A10 Networks: Attractive Valuation Caused by Reporting Issues

August 18, 2018 in Equities, Ideas, Letters

This article is excerpted from a letter by MOI Global instructor Jim Roumell, partner and portfolio manager of Roumell Asset Management (RAM), based in Chevy Chase, Maryland. Jim is a valued participant in The Zurich Project.

ATEN is listed on the New York Stock Exchange and is a provider of secure application solutions. Its portfolio of software and hardware solutions enables customers to secure their applications, users and infrastructure from internet, web and network threats at scale.

As the cyber threat landscape intensifies and network architectures evolve, ATEN provides customers with greater security, visibility, flexibility, management and performance for their applications. ATEN’s customers include cloud providers, web-scale companies, service providers, government organizations and other private enterprises.

During the fourth quarter of 2017, ATEN discovered that a mid-level employee within its finance department had violated the Company’s Insider Trading Policy and Code of Conduct. As a result, ATEN, with the assistance of outside counsel, conducted a review to ensure the accuracy of its reporting for 2017. The review did not identify matters that required material adjustments.

Members, log in below to access the restricted content.

Not a member?

Thank you for your interest.  Please note that MOI Global is closed to new members at this time. If you would like to join the waiting list, complete the following form:

Disclosure: The specific securities identified and described do not represent all of the securities purchased, sold, or recommended for advisory clients, and the reader should not assume that investments in the securities identified and discussed were or will be profitable. The top three securities purchased in the quarter are based on the largest absolute dollar purchases made in the quarter. Roumell Asset Management, LLC claims compliance with the Global Investment Performance Standards (GIPS®) and has prepared and presented this report in compliance with the GIPS standards. Roumell Asset Management, LLC has been independently verified for the periods January 1, 1999 through December 31, 2017. Verification assesses whether (1) the firm has complied with all the composite construction requirements of the GIPS standards on a firm-wide basis and (2) the firm’s policies and procedures are designed to calculate and present performance in compliance with the GIPS standards. Verification does not ensure the accuracy of any specific composite presentation. The Balanced Composite has been examined for the periods January 1, 1999 through December 31, 2017. The verification and performance examination reports are available upon request. Roumell Asset Management, LLC is an independent registered investment adviser. The firm maintains a complete list and description of composites, which is available upon request. Results are based on fully discretionary accounts under management, including those accounts no longer with the firm. Past performance is not indicative of future results. The U.S. dollar is the currency used to express performance. Returns are presented net of management fees and include the reinvestment of all income. Net of fee performance was calculated using actual management fees. From 2010 to 2013, for certain of these accounts, net returns have been reduced by a performance-based fee of 20% of profits, paid annually in the first quarter. Net returns are reduced by all fees and transaction costs incurred. Wrap fee accounts pay a fee based on a percentage of assets under management. Other than brokerage commissions, this fee includes investment management, portfolio monitoring, consulting services, and in some cases, custodial services. Prior to and post 2006, there were no wrap fee accounts in the composite. For the year ended December 31, 2006, wrap fee accounts made up less than 1% of the composite. Wrap fee schedules are provided by independent wrap sponsors and are available upon request from the respective wrap sponsor. Returns include the effect of foreign currency exchange rates. Exchange rate source utilized by the portfolios within the composite may vary. Composite performance is presented net of foreign withholding taxes. Withholding taxes may vary according to the investor’s domicile. The annual composite dispersion presented is an asset-weighted standard deviation calculated for the accounts in the composite for the entire year. Dispersion calculations are greater as a result of managing accounts on a client relationship basis. Securities are bought based on the combined value of all portfolios of a client relationship and then allocated to one account within a client relationship. Therefore, accounts within a client relationship will hold different securities. The result is greater dispersion amongst accounts. The 3-year annualized ex-post standard deviation of the composite and/or benchmark is not presented for the period prior to December 31, 2012, because 36 monthly returns are not available. Policies for valuing portfolios, calculating performance, and preparing compliant presentations are available upon request. The investment management fee schedule for the composite is as follows: for Direct Portfolio Management Services: 1.30% on the first $1,000,000, and 1.00% on assets over $1,000,000; for Sub-Adviser Services: determined by adviser; for Wrap Fee Services: determined by sponsor. Actual investment advisory fees incurred by clients may vary.

Public Private Equity: Volatility vs. Franchise Value

August 18, 2018 in Equities, Letters

This article is excerpted from a letter by MOI Global instructor Patrick Brennan, portfolio manager of Brennan Asset Management.

Throughout our past letters, we have discussed how public values and capital structures often look far different than those of private companies and noted how several of our current names would likely be the exact types of names (predictable businesses that generate substantial free cash flows) that have made private equity firms substantial money over the years. The private equity name is a bit of misnomer, considering that the largest firms are now public entities which are now referred to as alternative investment managers. These firms are often in the headlines on a daily basis, given their role in various merger transactions and their ubiquitous capital raising activity. The firms are also regularly lambasted for their extravagant pay to senior executives and are often whipping boys in any discussion about tax fairness. Despite their incredible growth in total assets under management (AUM), the stocks have generally been underperformers. As just one example, Blackstone’s (BX) stock is essentially flat since its public offering in 2007 (they have paid out $16.49 in dividends over this time period), while its AUM has roughly quintupled.

Private equity firms generally pay themselves an underlying management and incentive fee equal to a percentage of total profits above a hurdle rate of return. While the timing of the latter is nearly impossible to predict (and very difficult for investors to model), the carry fees offer enormous payouts over a cycle. And despite the higher fee levels, the alternative managers generally show significant outperformance relative to their benchmarks. Furthermore, investor assets are often locked up for multi-year periods, sometimes as long as 10-20 years, depending on the fund.

Additionally, the alternative managers have successfully expanded their franchises into private credit, real estate, insurance among several other verticals and nearly all have posted strong growth. These characteristics contrast with traditional managers who normally charge only base management fees, offer daily liquidity, have posted mixed results versus benchmarks and have suffered meaningful AUM losses to index funds. As the alternative equity firms are generally structured as partnerships, the vast majority of the businesses’ tax burden is pushed to the individual limited partners. So, which model sounds more attractive? Well, this is more difficult to ascertain if one simply looks at trading multiples, even considering the traditional managers’ significant 2018 stock pullbacks.


Source: Morgan Stanley Research

There are various explanations for the above contradiction. Some argue that the golden era for private equity cannot continue and returns are likely to compress, especially since such large amounts of committed but uninvested funds (dry powder) must be invested at high prices. Others argue that returns are merely a function of leverage and sector selection, and there is little to no alpha after these adjustments.[3] There is the possibility of tax law change on the carried interest and the certainty of interest deduction limitations. Additionally, a big market pullback will delay performance fees and could meaningfully lower earnings. Finally, these names are complex, have volatile earnings/stock prices and have K1 structures that make them difficult for many institutions to own. While all factors partially explain the valuation differentials, we suspect the last might be the dominant factor.

We have watched these names from a distance for years but passed for various reasons (including in 2010…particularly brilliant on our part), partially because of the worry about a change in the taxation of carried interest (still a concern) and the “cycle” timing. These names will sell off during market turmoil and therefore a better time to purchase would certainly be during a market dislocation. But, as we continued to do work over the past year, we spent more time thinking about the difficulty of trying to recreate these models. It might take 20+ years to create the track record and institutional goodwill that these names have attained. Should the firms technically compare their leveraged returns to leveraged S&P 500 returns? Sure, but how many investors could handle the volatility associated with that strategy? How many institutions have access to the deal flow, contact bases and data from all the various deals closed (and passed on) over time?

It is true that any market pullback will delay performance fees. But, with the private equity industry sitting on nearly $1.7 trillion in dry powder, these names would be well positioned to benefit from market declines. And while these nearly incomprehensible levels of funds might appear impossible to rationally invest, it should be noted that private markets are far larger than in past years with the total percentage of dry powder as a percentage of unrealized fair value actually below its longer-term average.

Source: Prequin, Morgan Stanley Research

Source: Prequin, Morgan Stanley Research

As noted, the industry’s fund-raising capabilities are immense. We can attest to the difficulty of raising small amounts of money. How likely would it be for a new firm to start at zero and eventually raise over $100 billion? On the most simplistic basis, it is worth asking: “What will be the alternative industry’s organic AUM levels over the next 1, 3, and 5 years?” We suspect the answer is “higher to significantly higher.” At a 2014 investor day, BX estimated fee growth of 12% annually, a 60% discount to historical levels. It is worth noting that some of the frequently discussed structural changes could conceivably help the largest alternative managers. Often the largest, most recognizable alternative managers take market share within the alternative space as institutions consolidate relationships. It is costly to closely track multiple managers and therefore the largest names often benefit when institutions reduce the number of mangers and/or benefit or suffer little damage when institutions reduce alternative allocations.

The alternative asset managers typically are valued on the basis of fee-related earnings, current carried interest and existing balance sheet assets. While one can argue that other firms screen cheaper on these metrics or have more room to grow total AUM (unclear they will actually do so), we believe that BX has the most diverse revenue stream and the strongest fund-raising franchise and therefore initiated a smaller position. Again, it is better to purchase these names during periods of market turmoil and therefore we’ve left substantial room to scale into the positions over time. Other alternative managers, with KKR the most recent, have announced plans to convert into a publicly traded company, willingly choosing to pay taxes in hopes that investors ascribe a higher multiple for the structure simplicity. BX pays less in taxes and such a decision would therefore be even more costly from a tax perspective. While a conversion would undoubtedly move shares higher shorter- term, we hope BX decides against such a move and instead opts to repurchase additional shares. We’ve heard that complex, tax-avoiding firms can actually do fairly well over time.

[3] Financial Analyst Journal Volume 72, July/August 2016: A Bottom-Up Approach to the Risk-Adjusted Performance of the Buyout Fund Market, Jean-François L’Her, CFA, Rossitsa Stoyanova, Kathryn Shaw, William Scott, CFA, and Charissa Lai, CFA.
[4] We show the year of each strategy’s first fund.

Disclaimer: BAM’s investment decision making process involves a number of different factors, not just those discussed in this document. The views expressed in this material are subject to ongoing evaluation and could change at any time. Past performance is not indicative of future results, which may vary. The value of investments and the income derived from investments can go down as well as up. It shall not be assumed that recommendations made in the future will be profitable or will equal the performance of the securities mentioned here. While BAM seeks to design a portfolio which reflects appropriate risk and return features, portfolio characteristics may deviate from those of the benchmark. Although BAM follows the same investment strategy for each advisory client with similar investment objectives and financial condition, differences in client holdings are dictated by variations in clients’ investment guidelines and risk tolerances. BAM may continue to hold a certain security in one client account while selling it for another client account when client guidelines or risk tolerances mandate a sale for a particular client. In some cases, consistent with client objectives and risk, BAM may purchase a security for one client while selling it for another. Consistent with specific client objectives and risk tolerance, clients’ trades may be executed at different times and at different prices. Each of these factors influences the overall performance of the investment strategies followed by the Firm. Nothing herein should be construed as a solicitation or offer, or recommendation to buy or sell any security, or as an offer to provide advisory services in any jurisdiction in which such solicitation or offer would be unlawful under the securities laws of such jurisdiction. The material provided herein is for informational purposes only. Before engaging BAM, prospective clients are strongly urged to perform additional due diligence, to ask additional questions of BAM as they deem appropriate, and to discuss any prospective investment with their legal and tax advisers.

Tim McElvaine Sums Up His Investment Thesis on GE

August 17, 2018 in Deep Value, Diary, Equities, Full Video, Ideas, Industrial Conglomerates, Large Cap, North America, Special Situations

General Electric, shunned by the investment community, has registered on the radar screens of a few value-oriented investors whom we deeply respect.

On August 9th, MOI Global member and Peter Cundill protege Tim McElvaine, founder and president of McElvaine Investment Management, posted a video explaining why the fund he manages recently bought shares of GE.

Watch the video below or on the website of The McElvaine Investment Trust:

Interested in further context on the GE turnaround?

Consider what MOI Global instructor Glenn Surowiec, portfolio manager of GDS Investments, wrote in his letter to investors in July:

… a cornerstone of successful investing is the ability to look ahead without dwelling on past mistakes. As present-day General Electric investors, we are buying into the future of the company, and not the past. In our 2017 Year-End Letter, we commented upon the appointment of new CEO John Flannery and looked ahead with our expectation that Mr. Flannery would reverse General Electric’s well-documented recent troubles by restructuring the company’s non-core businesses. That expectation is now reality.

On April 26, 2018, The Wall Street Journal reported that General Electric turned down an offer from Danaher Corporation (NYSE: DHR) to purchase General Electric’s Life Sciences unit at a price in the $20B range. That unit generates approximately one-quarter of GE Healthcare’s total sales, and General Electric’s refusal to sell in the stated price range speaks volumes about the value which the company places on Life Sciences. Further cementing that valuation is the fact that Siemens AG (FWB: SIE) recently spun-off its medical imaging and diagnostics division (Healthineers) for $35B. If the same valuation metrics which were applied to Healthineers were applied to GE Healthcare, General Electric shareholders could realize more than $60B from a spinoff of that unit . . . a spin-off which we expect will be completed within the next 12 to 18 months.

General Electric will soon close on a transaction to merge the transportation business component of GE Aviation with Wabtec Corporation (NYSE: WAB). In that $11B deal, General Electric will realize nearly $3B in cash while its shareholders will own 40.2% of the new company. The structure of that transaction will bring significant advantages while allowing General Electric, under Mr. Flannery’s leadership, to continue to optimize its portfolio of businesses.

We expect that optimization will include (A) General Electric’s sale of its gas engine business to private equity firm Advent International for $3B, (B) the company’s sale of its 62.5% stake in Baker Hughes (NYSE: BHGE) over the next 36 months, and (C) as noted, the spin-off of GE Healthcare.

The General Electric turnaround will not be quick, and it will require a healthy dose of the patience about which we wrote in our 2017 Year-End Letter. We remain confident, though, that patience will be well-rewarded.

Replay Glenn Surowiec’s session on GE at Best Ideas 2018.

Active vs Passive Investing

August 17, 2018 in Equities, Letters

This article is excerpted from a letter by Luis Sanchez and John Pelly, co-founders and managing partners of Overlook Rock Asset Management, based in New York.

Passive investing with index Exchange Traded Funds (“ETFs”) is all the rage now. Here we’ll briefly discuss what they are, why they’re such a great product for generating wealth for their investors (when used properly!), and how we view Overlook Rock’s strategy as being distinct from (and superior to) the index ETFs out there. In particular, we’ll focus on the “gold standard” ETFs: tickers SPY and IWV. We’ll save a more detailed discussion for a future write-up.

For those unaware of how ETFs work, think of them as a bundle of stocks that are sold as a unit. A manager (an investment corporation) constructs a bundle of stocks according to a set of rules and offers that bundle as a single security that you can buy and sell on a stock exchange (NYSE, NASDAQ, etc) with your broker (Merrill Lynch, Schwab, TD Ameritrade, etc). Roughly, when you buy/sell an ETF, the manager goes out and buys/sells the shares that make up that stock bundle, holds those stocks in the investment vehicle, and creates new shares of the ETF that you wind up holding.

Index ETFs are designed to track market indices. These products have proliferated significantly over the last decade – there are ETFs to track all manner of “indices.” Two in particular that we focus on for this discussion are the SPDR S&P 500 Trust ETF(ticker “SPY”, managed by State Street Global Advisors) and the iShares Russell 3000 ETF(ticker “IWV”, managed by Black Rock). The SPY consists of the 500 largest US stocks and the IWV consists of the largest 3000 stocks (including the 500 stocks in the SPY). The SPY and IWV are good proxies for the US stock market as a whole.

Again – we’ll save a lot of juicy details about the benefits and risks of index investing for another, purpose-built write-up. But for now, we’ll just say: We believe index investing is a foolproof way to get rich over time, provided:1) you do it the right way and 2) you can’t find a better way.

If we (John and Luis) were investing in SPY and/or IWV the “right” way, that would look roughly as follows:

  • Dollar cost average: Periodically invest our cash in roughly equal amounts on a regular basis-once a month or quarter, over several years. If we had a large amount of cash upfront, we’d spread it over 4-8 quarters.
  • Invest with a long term horizon: We would not invest any money that we would need to access in the next 5+ (ideally 10+) years.
  • Stick with it: Stay invested and do not sell holdings when there’s fear and panic (i.e. big drops).

Those steps are listed in increasing order of difficulty. Especially the last step. It can be excruciatingly difficult for many to hold onto their holdings when a recession hits and the market drops 20, 30, 40%. Numerous studies show how people pull their money out just at the bottom and put it back in close to the top. As a species, humans’ default emotional wiring is not well equipped to handle financial markets.

But those who follow the general instructions above would definitely get rich. Why? Because they are broadly participating in the incredible economic engine of the United States in a very low cost, effective manner.

Absent adding any real economic value, the vast majority of other investment products out there just can’t measure up. The sad fact is (with lots of data to back it up) that most other investment products out there under perform the S&P 500. They’re either “closet indexers” (mirroring the index but charging higher fees), or “(hyper)active managers” that don’t have the discipline, drive, or emotional fortitude to invest in a way that can repeatedly generate superior performance.

We want to emphasize that SPY and IWV are great ways to get rich, over a long period of time.

However, we’d like to get us and our clients richer faster (who wouldn’t?). We believe we’ve found a way to do it. Read on.

As mentioned above, passive ETFs (including SPY and IWV) pick stocks according to a set of rigid rules. For SPY / IWV, the process is:

  • Pick the 500 (SPY) or 3000 (IWV) stocks with the highest market capitalizations.
  • Hold each stock in a ratio equivalent to their market capitalization size.
  • Adjust the portfolio periodically to reflect steps 1-2 (once a quarter for SPY, once a year for IWV).

Quite simply, these are pretty brain-dead rules:

  • Picking a stock just because its market capitalization is high, and in proportion to the market cap size, is like buying a car solely because its expensive. If the dealer doubles the price, you would own twice as many…?!
  • Re-balancing like clockwork every quarter (for SPY) and every year (for IWV) is incredibly simple and in fact gamed – many active managers buy stocks (either new or increasing in portfolio weight) in anticipation of what SPY, IWV and others like are going to buy. This drives the prices of those stocks up ahead of the ETF purchases, enriching others at the ETF investor’s expense.

And yet, every dollar you invested in SPY 5 years ago (starting June 28, 2013) to the last trading day of the quarter we write about (June 29, 2018) would be worth just under $1.87, for a compound annual rate of return of 13.3%. Maybe a brain dead scheme can work?

Let’s look at another 5 year period: March 15, 2004 to March 9, 2009. Over this period an investment in SPY would have turned $1 into $0.66, a compound loss of 8.1% per year.

That takes a bit of shine off SPY! Now, for those of you that know your financial market history, you’d know that March 9, 2009 was the absolute bottom tick of SPY during the Great Recession. So you could legitimately argue we carefully picked the start and end dates to prove how bad SPY can be. Fair enough – but also keep in mind that that 13.3% number is coming from the other side of that very low point, and is a very unrealistic assessment of what we can expect from SPY over the long run, and extremely unrealistic of where SPY could go over the next 5 years. On the whole, it is far, far more likely to be much less than 13%.

Empirically, the data show that the “long run” (10+ years) average returns for SPY is in the 8-10% per year range. This assumes you stay invested that entire period and reinvest your dividends.

Not a bad long term expectation, but at Overlook Rock, we think we can do better. Here’s why:

We have developed a set of rules that are much more profitable than those embodied by SPY and IWV as outlined above. They are derived from first principles regarding what makes for a valuable business by looking at a company’s fundamentals, then empirically tested over almost 20 years of historical data. In aggregate, the companies selected by these rules should meaningfully outperform SPY and IWV over time, even net of our fees.

We evaluate the entire universe of stocks, scouring for those that are cheap relative to earnings, high quality (have sustainable competitive advantages), or are paying decent dividends. We sell when those criteria no longer hold, and put clients into other cheaper, higher quality, or greater dividend paying names. By systematically keeping the portfolio focused on these 3 characteristics, we expect to dramatically improve on passive products.

That’s why we set our bogeys as SPY and IWV, and report them alongside our performance. SPY and IWV are both simple, easy ways to outperform 80%+ of the investment managers out there. If we can’t beat both the SPY and IWM over the long run, net of fees,we need to find a new job.

We believe this is a higher standard than most investment managers are willing to live by – in other words, perfectly appropriate for our clients.

Disclaimer: Overlook Rock Asset Management is a registered investment adviser. Information presented is for discussion and educational purposes only and does not intend to make an offer or solicitation for the sale or purchase of any specific securities, investments, or investment strategies. Investments involve risk and, unless otherwise stated, are not guaranteed. Be sure to first consult with a qualified financial adviser and/or tax professional before implementing any strategy discussed herein. The information and statistical data contained herein have been obtained from sources, which we believe to be reliable, but in no way are warranted by us to accuracy or completeness. We do not undertake to advise you as to any change in figures or our views. This is not a solicitation of any order to buy or sell. We, any officer, or any member of their families, may have a position in and may from time to time purchase or sell any of the above mentioned or related securities. Past results are no guarantee of future Results. This report includes candid statements and observations regarding investment strategies, individual securities, and economic and market conditions; however, there is no guarantee that these statements, opinions or forecasts will prove to be correct. These comments may also include the expression of opinions that are speculative in nature and should not be relied on as statements of fact. Overlook Rock Asset Management is committed to communicating with our investment partners as candidly as possible because we believe our investors benefit from understanding our investment philosophy, investment process, stock selection methodology and investor temperament. Our views and opinions include “forward-looking statements” which may or may not be accurate over the long term. You should not place undue reliance on forward-looking statements, which are current as of the date of this report. We disclaim any obligation to update or alter any forward-looking statements, whether as a result of new information, future events or otherwise. While we believe we have a reasonable basis for our appraisals and we have confidence in our opinions, actual results may differ materially from those we anticipate. The information provided in this material should not be considered a recommendation to buy, sell or hold any particular security.

EQUAM Capital sobre TI Fluid Systems e Imperial Brands

August 17, 2018 in Ideas de inversión, MOI Global en Español

NOTA DEL EDITOR: Estas ideas de inversión son extraídas de una carta de EQUAM Global Value Fund.

* * *

Durante el segundo trimestre hemos realizado tres nuevas inversiones. Una de ellas, TI Fluid Systems [LON: TIFS] es una compañía de componentes de automoción con una posición de liderazgo en sus dos divisiones: sistemas de fluidos para refrigeración y frenos, entre otros, donde la compañía tiene una cuota del 35% y es tres veces más grande que su siguiente competidor; y depósitos de gasolina de plástico donde es uno de los tres principales competidores a nivel mundial. Existe cierto temor en el mercado por el impacto que puede tener en el negocio de TI Fluid la transición desde el coche de combustión hacia los modelos híbridos o puramente eléctricos. Sin embargo, la compañía estima que aunque como es obvio la división de depósitos sufrirá (con el coche eléctrico, no así con el híbrido), el impacto en conjunto será positivo debido a la necesidad de mayores componentes de transmisión de fluidos en los coches eléctricos. Por otro lado, es cierto que la compañía tiene unos niveles de deuda algo superiores a la media del sector, pero creemos que se mantiene en unos niveles razonables (1,8x deuda neta / EBITDA) si tenemos en cuenta su fuerte capacidad de generación de caja. Cotizando a 7,5x PER y un FCF yield del 11% creemos que supone una atractiva inversión. Esta valoración está también afectada por otros dos hechos: i) la compañía está cotizada en el Reino Unido, reporta en euros y tiene a su equipo directivo en Estados Unidos, lo que genera cierta complejidad para algunos inversores; y ii) Bain Capital sacó a bolsa la compañía a finales de 2017 pero todavía mantiene una participación del 73% lo que reduce de manera significativa el free float e introduce en el mercado un riesgo de caida por posible venta de este inversor (para nosotros esto no es un riesgo ya que no afecta a la valoración).
Continue reading »

Highlighted Tweet by NeckarValue

August 16, 2018 in Twitter

Hidden Advantages to Hybrid Public-Family Businesses

August 14, 2018 in Equities, Featured, Jockey Stocks, Letters

This article is authored by MOI Global instructor Will Thomson, managing partner of Massif Capital, a value-oriented partnership focused on the small- and mid-cap space, with special attention on industrial and commodity-related businesses.

“A finite game is played for the purpose of winning, an infinite game for the purpose of continuing to play.” –James P. Carse

Most companies believe they are in a finite game, playing against a timeline of quarterly earnings with known competitors and known rules for determining a winner. A 2005 study from Duke University found that close to 80% of Chief Financial Officers of the 400 largest publicly traded U.S. companies would rather sacrifice the firm’s economic value to meet quarterly expectations. The “game” of business is an infinite game and sacrificing value for short-term market appeasement is a losing strategy. Long-term value is predicated on endurance and firms that use growth merely as a vehicle to sustain or appreciate the share price, will not survive.

Introduction

When we examine a new firm, we look to create a framework that allows us to study the long-term incentive structure and the capital allocation decision process of the management team. Additionally, a framework provides a template to identify the strengths and weakness of similar firms and more quickly assess the likelihood that a firm holds a competitive advantage relative to their peers.

An often-overlooked business model is the hybrid public-family business. Hybrid public-family businesses (“family business”) are publicly traded, family-controlled firms. Families need not necessarily have founded the firm, although they often do, nor do they need to be majority shareholders, but usually are. These firms often defy simple categorization – not only do they include multi-billion-dollar corporations in almost every industry, but also include a significant percentage of all small and mid-capitalization companies globally.

Family businesses today are a diverse and adaptive collection of organizations that often get criticized for corporate backwardness, paternalism, and operational weaknesses. Many family businesses are the backbone of emerging economies and remain at the core of most developed countries small and medium-size business ecosystems. Despite the presumed shortcomings, these firms tend to outperform other publicly traded business with other corporate structures.

What follows is a proposed framework that highlights the inherent strengths of family businesses and how those strengths closely align with our view of an enduring organization that can deliver long-term value to shareholders. One of the reasons we find the framework so appealing is that successful family businesses seem to be a highly distilled version of the traits of many successful long-term enterprises, be they family businesses or not.

Family Business Context

Family businesses are characterized by a combination of two institutions, the family, and the business. Historically this form of business organization not only contributed significantly to economic development but was the worlds principal business structure. This is especially true for economies before the emergence of a large-scale manufacturing business in the United States in the 1870s.[1]

The second industrial revolution, which is generally considered to be the period from 1870 to 1914, is perhaps best characterized by the resulting spread of capital-intensive industries with complex production and distribution channels. The growth in complexity and capital intensity was accompanied by (or perhaps necessitated) a shift from family capitalism to financial capitalism, and the emergence of “modern management practices.” According to Alfred Chandler, this transition was the beginning of the end for the dominance of the family firm as “no family or financial institution was large enough to staff the managerial hierarchies required to minister modern multiunit enterprises.”[2]

The post WW2 period has seen the public perception of the family firm as being in a state of permeant decline. Family firms were incapable of competing since the advent of the large, professionalized managerial enterprises solidified, especially in the volumes of literature on business structure and management practices. As Danny and Isabel Miller noted in their in-depth study of the competitive advantages of family businesses, Managing for the Long Run, the public perception seems strange given the numerous examples of successful family firms discussed in the voluminous literature on how different companies succeeded, such as In Search of Excellence and Built to Last.

The Miller’s highlight this oddity stating: “When, via a mutual friend, we passed on this observation [the observation that so many examples of successful firms and businesses as family-run firms] to one of the authors of these books [In Search of Excellence], his response was, ‘The companies were successful despite being FCBs [Family Controlled Business].’ Like many businesses scholars, he seemed to be missing the point.”[3] We agree business scholars seemed to have missed the point.

The failure of business scholars begins with their inability to recognize the flexibility of the family business model. Specifically, the inability to grasp that while family businesses in a traditional sense persist as essential parts of the economy, the hybrid public-family business model does as well, for example, the Lundin Group of companies, or any number of Asian family-owned industrial conglomerates. In the case of the Lundin Family, whenever they decided to develop a resource, be it a mine or an oil and natural gas deposit, the family utilized the hybrid public family business model: retaining management control for the family while turning over technical tasks to more-experienced companies and drawing on capital from retail and institutional investors around the globe.

The Framework

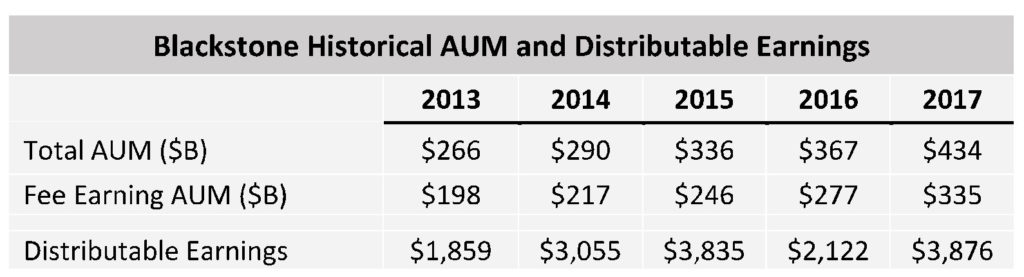
There are three unique characteristics we identify in a hybrid family business model that are at the core of their success:
1. An inherent alignment of owner and manager interests;
2. The presence of multigenerational time horizons, and;
3. The implementation of a value-based system versus a resource-based system.

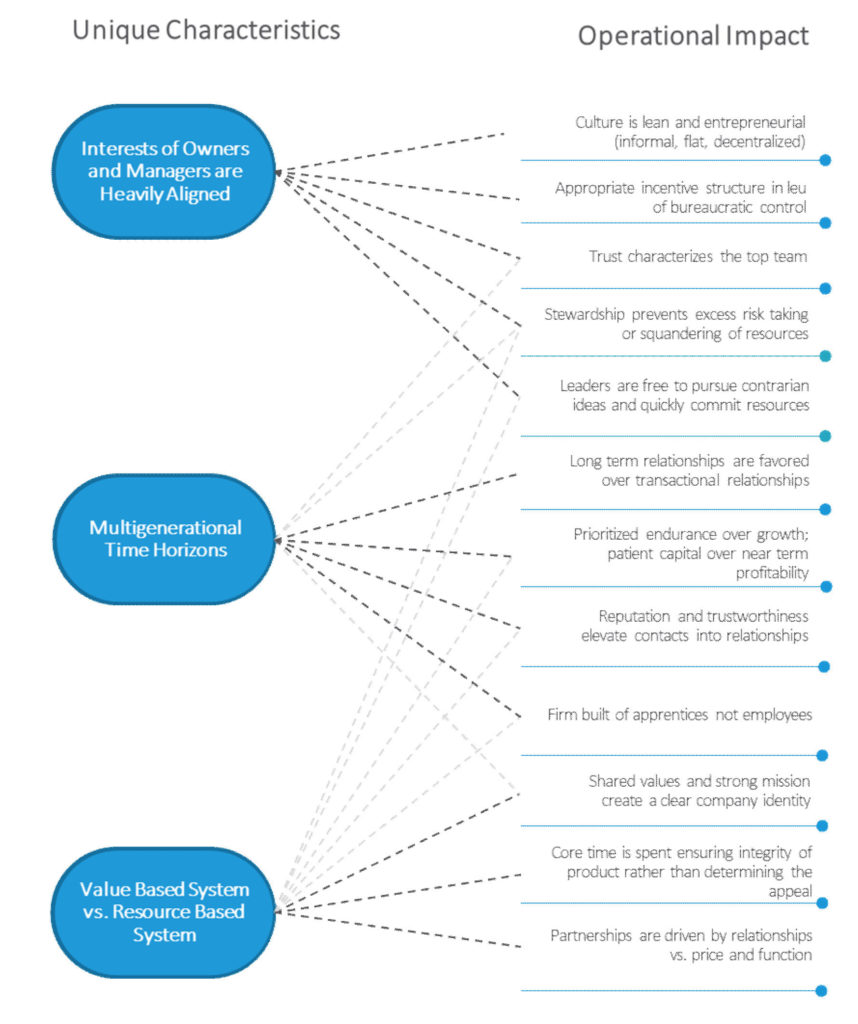
Each characteristic has a subsequent impact on operations. The operational impact of these traits not only govern how the firm is managed but also impact its reputation and its earning power. Ultimately, we believe these operational impacts produce real value.

Within family business groups, owners and managers are often synonymous. The resulting alignment creates an environment where risk and reward are understood as one in the same. Drawing parallels to ‘skin in the game,’ managers must manage risk knowing they are exposed to its consequences. Similarly, they are motivated to pursue greater earnings, understanding that they will share in the reward.

Ownership provides a simple, effective, and often inexpensive method to prevents excess risk-taking while creating an environment where leaders are free to pursue contrarian ideas and quickly commit resources.

Ownership though is not the same things as owning stock because of a compensation arrangement. This is a point missed by most. Stock options, the most common source of compensation for management teams at publicly traded companies, is a financialized derivative, an abstraction masquerading as ownership. Ownership typically requires hard work and is accompanied by illiquidity, a lack of diversification and a lack of concern regarding the moment to moment liquid value of something. These are characteristics of ownership that bring focus to management activities. Ownership also tends to come with the weight of history.

Multi-generational ownership comes with a sense of responsibility and stewardship. Growth is too easily pursued at the expense of a balance sheet in a world awash with money and is too often thought of as the “end goal’ or “objective.” Growth is merely directional guidance though and does not indicate “why” a firm is growing, or “where” it is looking to grow to. Preservation of inherited assets and a deep sense of responsibility to protect the long-term health of the company are often paramount for family businesses. Endurance is prioritized over growth; patient capital is deployed at the expense of near-term profitability. While the result may not yield the new darling of Wall Street, it provides investors who care about the preservation of capital an excellent store of long-term value.

Finally, hybrid family businesses tend to make decisions based on a set of values, often passed down from the founding entrepreneur. Most businesses have some semblance of a value statement or mission, but very few allocate resources based on those values. In periods of market volatility or intense competition, companies will often allocate resources to mirror what their successful counterparts are doing. In a value- based system, the market and competitors are certainly important input variables; however, they do not govern the actions of the firm. Shared values create a clear company identity, and resources are spent ensuring the integrity of the company rather than the short-term appeal.

The alignment of owners and managers, multi-generational time horizons and value-based decision making all have operational impacts that produce long-term value. Value is frequently discussed in the context of a listed market price relative to the firm’s estimated intrinsic value; looking beyond price, a firms value can be assessed through the lens of a firm’s independence, endurance, and scarcity. For example, firms, where leaders are free to commit and allocate resources efficiently, have healthier balance sheets then firms weighed down by bureaucracy, and an inability to produce succinct and focused decisions. Similarly, firms that can monetize their reputation and trustworthiness and then nurture and prioritize that relationship are built to endure. A firm that focuses intently on their ability to endure, not merely to grow are often excellent companies to consider for a long-term store of value.

Finally, firms that have an intense value system and allocate resources accordingly, often produce products of such quality that they create market scarcity. In the long run, they serve an economic or social need that creates natural barriers to entry for industry competitors.

It would be inaccurate to presume that all hybrid family businesses share these characteristics, yet many do. While success can always be attributed to a product, an individual, or market dynamics, we believe the traits we have outlined above often define hybrid family businesses and lay a foundation for an enduring company.

[1] The History of Family Businesses 1850 -2000, pg. 6.
[2] Managerial Hierarchies. Comparative Perspectives on the Rise of the Modern Industrial Enterprise.
[3] Managing for the Long Run, pg. 13.

Disclaimer: Opinions expressed herein by Massif Capital, LLC (Massif Capital) are not an investment recommendation and are not meant to be relied upon in investment decisions. Massif Capital’s opinions expressed herein address only select aspects of potential investment in securities of the companies mentioned and cannot be a substitute for comprehensive investment analysis. Any analysis presented herein is limited in scope, based on an incomplete set of information, and has limitations to its accuracy. Massif Capital recommends that potential and existing investors conduct thorough investment research of their own, including a detailed review of the companies’ regulatory filings, public statements, and competitors. Consulting a qualified investment adviser may be prudent. The information upon which this material is based and was obtained from sources believed to be reliable, but has not been independently verified. Therefore, Massif Capital cannot guarantee its accuracy. Any opinions or estimates constitute Massif Capital’s best judgment as of the date of publication and are subject to change without notice. Massif Capital explicitly disclaims any liability that may arise from the use of this material; reliance upon information in this publication is at the sole discretion of the reader. Furthermore, under no circumstances is this publication an offer to sell or a solicitation to buy securities or services discussed herein.

La filosofía de inversión de Solventis

August 13, 2018 in Miscelánea, MOI Global en Español

NOTA DEL EDITOR: El siguiente texto es obtenido de una carta de Solventis EOS.

* * *

El dicho popular “Sell in May and go away” o traducido al castellano “vende en mayo y márchate (de los mercados)” recorre todas las plazas financieras durante este mes del año. La expresión sugiere a los inversores que vendan todas sus acciones y se alejen de la bolsa, ya que históricamente en este período de tiempo se ha logrado menor rentabilidad. A veces se le añade la coletilla “pero compra de nuevo el día de san Leger”, festejo de septiembre en el que se celebra una de las más importantes carreras de caballos en Gran Bretaña.

Éste y otros dichos evidencian la obsesión de los inversores por adivinar el momento exacto de entrada y salida de los mercados financieros. Sin embargo, nuestra tarea como gestores no reside tanto en acertar el momento preciso de compraventa sino la empresa a comprar o vender. La razón no es otra que el retorno y el precio. Si unimos retornos altos a la inversión que puede obtener la empresa más el precio barato pagado por ella, nos da como resultado una excelente rentabilidad, y ésta es independiente del mes en que se compre. Por todo ello concentramos nuestros esfuerzos en la búsqueda y análisis de compañías que presenten ciertas ventajas competitivas y que por supuesto ofrezcan un potencial de revalorización atractivo.
Continue reading »

MOI Global