I met Munger in my USC graduate school investment class & had the opportunity to ask him this important question, “If I could do one thing to make myself a better investment professional, what would it be?"
He answered, “Read history! Read history! Read history!"~Bob Rodriguez
— Gautam Baid (@Gautam__Baid) August 1, 2018
This article is authored by MOI Global instructor Jim Roumell, partner and portfolio manager of Roumell Asset Management (RAM), based in Chevy Chase, Maryland. Jim is a valued participant in The Zurich Project.
The world is flattening. Information ricochets around the globe in nanoseconds. Sophisticated investment algorithms are increasingly replacing human analysis, instinct and temperament. Indeed, the world has changed. The internet has commoditized information and gaining an “information edge” is harder today compared to yesteryear. Charles Ellis, onetime chair of Yale’s storied investment committee, now says active managers once had an edge but not anymore. According to Ellis, “Today, everyone knows everything at the same time.”
RAM has long recognized the near herculean challenge in adding investment value in selecting securities in highly liquid markets. Thus, we have pursued value most often in small, if not tiny, companies that are “out of favor, overlooked, or misunderstood.” In fact, our top five holdings are all micro-caps. Investors ought to demand that their active managers specify the source of their investment edge (justifying an active management fee).
We’ve always emphasized a concentrated portfolio where our investment edge is the result of gaining superior information on small securities resulting from relentless shoe leather work supported by a rich ecosystem of industry contacts. Our top ten holdings comprise over 40% of our portfolio. Secondarily, we believe we possess a behavioral edge resulting from temperamental strength expressed by our ability to consistently go against the crowd.
We would add another important overall factor — keeping assets under management small. The investment industry, like all industries, wants to grow. We want to limit our growth. We believe growth in assets under management diminishes investment returns of active management. Short of bear market pricing, it is increasingly clear to us that maintaining a modest asset base ($250–$300 million maximum versus the current $100 million) is critical in order for us to add value to our clients’ portfolios.
We are committed to adding value to our clients or graciously stepping off the stage if we determine that “everyone knows everything at the same time” and that it’s true for all markets and hence adding value is a mirage. We have sound reason to believe that an information edge is still possible, and coupled with temperamental strength, can sum to value creation. In our “Investment Philosophy” piece written several years ago we provided the following description of the source of our investment edge:
“While math and accounting skills are important, they can only go so far in developing the narrative of an investment opportunity. A large appetite for detective work, in our view, is necessary to gain an investment edge. Roumell Asset Management is at its best when finding small, undiscovered opportunities before investor crowds arrive. Detective work is particularly valuable in getting to the bottom of these undiscovered ideas. At its most elemental level, an investment is a play wherein the investor shows up in the middle act rather than the first. The investment story may be the potential monetization of hidden assets or an increase in future earnings power vis-à-vis market share gains, margin expansion, or secular trends. The analyst needs to ask: what is the nature of the challenge faced by these actors and what are the odds that their methods of engagement will result in a favorable resolution to the specific struggle embedded in this story? In summing up a business’s prospects, what do customers, competitors, and others circling the story really think of the enterprise and its leaders? To answer all these questions, we believe you cannot just sit in your office and read about a company and its numbers. Therefore, our research process is relentless and includes regular travel to see management teams, assets, customers, and competitors first hand.”
Recent travels underscore our conviction that scuttlebutt (investigative journalism) provides real value to our investors.
Dundee Corporation, a small (roughly $70 million capitalization) Canadian company discussed later in this letter, is now one of RAM’s top holdings. Dundee has no active sell-side coverage, is deeply out of favor, once boasted a $1 billion plus market cap, is difficult to understand and consequently uniquely situated to be a source of investment value creation, in our opinion. In early June, I traveled to Toronto to attend the company’s annual shareholder meeting. I was one of two investors from outside of Toronto who attended the meeting. Afterwards, I joined management and the company’s board for a wonderful salmon dinner sourced from the company’s AgriMarine Holdings, Inc. subsidiary.
In addition to spending quality time with Jonathan Goodman, CEO, and Robert Sellars, CFO, I met key management team members overseeing some of the company’s most important investments. Richard McIntyre, COO, is heading up the company’s Vancouver Parq Casino investment. Richard seems exceptionally well-suited, both professionally and temperamentally, to renegotiate Parq’s debt and also to oversee the monetization of Dundee’s Blue Goose investment. He is joined by seasoned veteran L. Geoffrey Morphy, Vice President, Corporate Development. Dundee is described in greater detail below. What I can attest to is that there are some very competent management members, led by a new, albeit legacy controlling family member, CEO in Jonathan Goodman.
Spending three days in Vancouver this month visiting the Dundee’s Parq Casino and Hotel was one of the nicer company visits in memory. Vancouver, rated by Mercer as being the number one North American city to live in, and fifth in the world, is a wonderful city. The Parq property is a Class A asset with first rate amenities. It strategically sits next to the Rogers Arena, home of the Vancouver Canucks as well as a venue for some of the biggest concerts in the city. Parq is now the largest convention venue in Western Canada. Joe Burnini, Parq’s President and on-site operator, provided me a detailed walkthrough of the property. I spoke with many of Parq’s line workers which gave me a good sense of their view of the property, what’s working and what needs further attention.
While in the upper Northwest I also visited top holding Marchex (MCHX), located in Seattle. I met with the company’s chief software engineer and believe we continue to own a unique company well positioned to capitalize on providing call analytics to companies wanting to dramatically increase the measurement of their call generating marketing efforts. Marchex is making big inroads into the auto industry given the large network of dealerships still reliant on traditional phone calls. The call volume on MCHX’s call-analytics platform is steadily increasing, bolstered by the company’s A.I. capabilities. The company remains exceptionally well-capitalized and is committed to investing in its R&D while remaining free cash-flow breakeven. However, MCHX could certainly move to less desirable office space (now overlooking the Puget Sound from central downtown) and save a few bucks.
Does sitting down with management and chatting up employees add value to the investment process? We firmly believe that it does if one has the people skills and the interviewing acumen to accomplish the task at hand — to gain a deep understanding of the company’s dynamics and handicapping the probability that management/board can successfully execute on its stated goals. In our Investment Philosophy piece, we noted:
“Interestingly, little has been written about an investor’s interviewing skills as a tool for unearthing the truth. The FBI has virtually made a science of the interviewing process with such techniques as first asking a number of questions with known answers to help establish the credibility of the interviewee. For investors like ourselves, once contact has beenestablished with management, an industry source, a competitor, or another player, questions emerge through imagination, creativity and time — all with the goal of getting to the bottom of the story.
Of equal importance to interviewing skills is the analyst’s ability to create lasting relationships within various industries. These relationships can provide unique insights and perspectives that can be invaluable in piecing together an investment mosaic. For many years, we have cultivated strong personal contacts that help us in numerous ways: finding new ideas, discussing internally generated ideas, and knowing when to stay away from others.”
It is also a core belief that behavioral edge is a critical component of our “secret sauce.” We do not hesitate to average down after a security’s price has gone against us if we determine the presence of compelling value. We’re disciplined in selling when we believe an adequate margin of safety is no longer present despite the security gaining in popularity in the investment community. We’re not easily “thrown off.” Kenny Rogers was on to something when he sung The Gambler:
You got to know when to hold ‘em, know when to fold ‘em,
Know when to walk away and know when to run.
You never count your money when you’re sittin’ at the table.
There’ll be time enough for countin’ when the dealin’s done.
Perhaps the best line in The Gambler is this one: ‘Cause ev’ry hand’s a winner and ev’ry hand’s a loser. Those are wise words. Some of RAM’s biggest winners began as losers, but after reducing our average cost they became big winners. Whether the investment outcome is a winner or loser will often be determined by a single human attribute— temperament.
We will continue to get out of the office and kick the tires of our investments. We will remain steadfast in our guiding principles and we will not overreact to market and/or security movements.
We are assisted in our efforts this summer by Edwin Kye. Edwin will be a senior at Cornell University in the fall and is one of the best summer interns we’ve ever been afforded. Among other projects, Edwin conducted research on Destination XL, including visiting several stores, that was woven into a very thoughtful, data-rich analysis of this RAM holding. He also conducted extensive social media research tracking guest surveys for the Parq Vancouver, an asset of another one of our holdings, Dundee Corp.
Disclosure: The specific securities identified and described do not represent all of the securities purchased, sold, or recommended for advisory clients, and the reader should not assume that investments in the securities identified and discussed were or will be profitable. The top three securities purchased in the quarter are based on the largest absolute dollar purchases made in the quarter. Roumell Asset Management, LLC claims compliance with the Global Investment Performance Standards (GIPS®) and has prepared and presented this report in compliance with the GIPS standards. Roumell Asset Management, LLC has been independently verified for the periods January 1, 1999 through December 31, 2017. Verification assesses whether (1) the firm has complied with all the composite construction requirements of the GIPS standards on a firm-wide basis and (2) the firm’s policies and procedures are designed to calculate and present performance in compliance with the GIPS standards. Verification does not ensure the accuracy of any specific composite presentation. The Balanced Composite has been examined for the periods January 1, 1999 through December 31, 2017. The verification and performance examination reports are available upon request. Roumell Asset Management, LLC is an independent registered investment adviser. The firm maintains a complete list and description of composites, which is available upon request. Results are based on fully discretionary accounts under management, including those accounts no longer with the firm. Past performance is not indicative of future results. The U.S. dollar is the currency used to express performance. Returns are presented net of management fees and include the reinvestment of all income. Net of fee performance was calculated using actual management fees. From 2010 to 2013, for certain of these accounts, net returns have been reduced by a performance-based fee of 20% of profits, paid annually in the first quarter. Net returns are reduced by all fees and transaction costs incurred. Wrap fee accounts pay a fee based on a percentage of assets under management. Other than brokerage commissions, this fee includes investment management, portfolio monitoring, consulting services, and in some cases, custodial services. Prior to and post 2006, there were no wrap fee accounts in the composite. For the year ended December 31, 2006, wrap fee accounts made up less than 1% of the composite. Wrap fee schedules are provided by independent wrap sponsors and are available upon request from the respective wrap sponsor. Returns include the effect of foreign currency exchange rates. Exchange rate source utilized by the portfolios within the composite may vary. Composite performance is presented net of foreign withholding taxes. Withholding taxes may vary according to the investor’s domicile. The annual composite dispersion presented is an asset-weighted standard deviation calculated for the accounts in the composite for the entire year. Dispersion calculations are greater as a result of managing accounts on a client relationship basis. Securities are bought based on the combined value of all portfolios of a client relationship and then allocated to one account within a client relationship. Therefore, accounts within a client relationship will hold different securities. The result is greater dispersion amongst accounts. The 3-year annualized ex-post standard deviation of the composite and/or benchmark is not presented for the period prior to December 31, 2012, because 36 monthly returns are not available. Policies for valuing portfolios, calculating performance, and preparing compliant presentations are available upon request. The investment management fee schedule for the composite is as follows: for Direct Portfolio Management Services: 1.30% on the first $1,000,000, and 1.00% on assets over $1,000,000; for Sub-Adviser Services: determined by adviser; for Wrap Fee Services: determined by sponsor. Actual investment advisory fees incurred by clients may vary.
Market Overview: High Valuations Reflect High Expectations
August 4, 2018 in Commentary, Equities, LettersThis article by Matthew Haynes is excerpted from a letter of 1949 Value Advisors, an absolute return-oriented global value investment firm based in Mahwah, New Jersey. Matt is a valued contributor to The Zurich Project.
Global equity markets generally rose (in local currency terms) during the second quarter, but the strengthening US dollar reduced unhedged returns to a modest decline in all but a few foreign markets.
It continues to be a difficult environment for global value investors, evidenced by the MSCI World Growth Index outperforming its value index complement by 3.7% during Q2 and by 7.4% year-to-date. The cumulative outperformance of growth over value since the start of 2017 has been severe at +19.3%, using the MSCI indices. Though not as severe as the eighteen month period preceding the peak of the internet bubble in March of 2000, the two periods are remotely similar.
First, both time periods were marked by narrow market leadership of richly valued technology stocks. One big difference, however, is that the “FAANG” stocks of today (Facebook, Amazon, Apple, Netflix and Google) command a large share of their respective (and more mature) markets and their business models have since been proven successful – very successful, in fact, even if long term sustainability amidst serious competition remains a question for some. A similar class of technology giants exist in Asia known as the “BATS” (Baidu, Alibaba, Tencent and Samsung), with comparable perceptions of invincibility driving already high valuations higher there too.
Valuation is a proxy for investor expectations: high valuation = high expectations of business performance. With many technology company valuations already implying great expectations, there is risk if analyst forecasts fall short. (with two exceptions: both Apple and Samsung valuations are very reasonable today. We have owned shares in both Apple and Samsung in client portfolios since the inception of the 1949 Global Value Strategy in July 2015.)
Another similarity worth mentioning is that both periods followed a prolonged advance in equity markets. Perhaps typical for a late stage bull market, investors have favored the perceived certainty of prevailing market leadership to the detriment of inexpensive stocks of companies with temporary issues. The behavior can be self-reinforcing, for a while, and the catalyst for a change in regime is elusive except in hindsight.
Many differences between these two periods exist, and while valuation and investor behavior are not mutually exclusive, their significance shouldn’t be dismissed. After all, history has a tendency to rhyme.
Value investing has proven the test of time, despite occasional periods of prolonged underperformance. Our approach to global value investing is designed to deliver both safety of principal and attractive absolute returns over the long term.
We believe that the best long term investment track records are as much about preserving capital during market downturns as they are about participating in market upturns. We strive to achieve this by building a portfolio of high-conviction securities that we believe are trading at large discounts to intrinsic value, with each holding’s financial strength and discounted valuation mitigating aggregate portfolio risk.
Disclaimer: The performance results for the 1949 International Value Strategy set forth herein are model results and not based on the performance of actual portfolios managed by 1949 Value Advisors (the “Investment Manager”). The performance results were obtained through the use of Bloomberg’s proprietary software and represent the simulated returns of a secondary strategy the Investment Manager is honing alongside its primary strategy. The results do not reflect fund or account-level investment expenses, administrative, operating expenses or management fees. A fund or account managed by the Investment Manager will be subject to asset based management fees, and would incur significant investment and administrative/operating expenses; these fees and expenses would significantly reduce the returns of an actual investment due to compounding and other effects. These performance results do not represent actual trading and are not an indication that the performance of any fund or account managed with this strategy will be similar in any way. This summary does not constitute an offer to sell or the solicitation of an offer to purchase any security or investment product. Any such offer or solicitation may only be made to qualified investors and only by means of an approved confidential private offering memorandum or investment advisory agreement and only in those jurisdictions where permitted by law. This summary reflects select positions of the current portfolio of a managed account advised by 1949 Value Advisors. There is no guarantee that a commingled investment vehicle or another investment account managed by 1949 Value Advisors will invest in the same investments set forth in this summary. The investment approach and portfolio construction set forth herein may be modified at any time in any manner believed to be consistent with the managed account’s overall investment objectives. While all information herein is believed to be accurate, 1949 Value Advisors makes no express warranty as to the completeness or accuracy nor does it accept responsibility for errors appearing in the summary. This summary is strictly confidential and may not be distributed.
BlackBerry: un foso amplio gracias a las patentes
August 3, 2018 in Contenido Libre, Ideas de inversión, MOI Global en EspañolAre you a member? Access full session
NOTA DEL EDITOR: Esta breve idea de inversión escrita por Rodrigo López Buenrostro, socio-analista en KuE Capital y miembro de MOI GLOBAL, fue presentada en Wide-Moat Investing Summit 2018.
* * *
John Chen ha completado la transición de BlackBerry de una empresa de smartphones a una compañía de software con aproximadamente US$1 mil millones en ingresos y creciendo. La reputación de BlackBerry para la seguridad de los dispositivos móviles, está enfocada en un sistema integrado de Internet de las cosas y su gran cartera de patentes los hacen muy útiles para el futuro. Su plataforma QNX ha tenido mucho éxito con la construcción de sistemas de automóviles autónomos para las principales compañías automotrices, y su Radar para la industria transportista continúa sobresaliendo
— Prem Watsa, Carta a los Accionistas de Fairfax Financial Holdings, 2017.
«Espera, pensé que BlackBerry ya no existía…» es una frase que he escuchado bastante a menudo en los últimos meses. No culpo a estas personas ya que BlackBerry [BB] no es el fabricante de smartphones que mucha gente en el mundo solía conocer. Actualmente, los clientes más importantes de BB son: el gobierno, los bancos, las compañías aseguradoras, los hospitales y los grandes OEM de automóviles. De hecho, muchos de estos clientes se han mantenido como clientes de BlackBerry desde que la compañía comenzó en la década de 1990, gracias al sólido legado de la compañía en comunicaciones seguras.
Continue reading »
This article is excerpted from a letter by MOI Global instructor Patrick Brennan, portfolio manager of Brennan Asset Management.
In past letters, we’ve noted that a repeating set of various macroeconomic concerns (Greece indebtedness, European Union stability, and China debt levels) would periodically be magnified in a given quarter.
For this reason, a reader could save time by simply pulling one of our old letters and skimming the first couple of paragraphs to see a high correlation to what we are about to say. But, interestingly, while the above concerns still exist, they have been pushed to the back burner as investors are fixated on the real possibility of a worldwide trade war.
As we write this second quarter letter, the US appears to be contemplating $200 billion of additional tariffs after initially establishing $50 billion of tariffs on Chinese imports ($34 billion have been implemented). China has responded with 25% tariffs on a host of different products.
Certainly, trade restrictions are not helpful for business confidence and a prolonged period of restrictions could cause real damage. That said, there is considerable uncertainty on whether all the proposed tariffs will be fully implemented and, if so, for how long.
Dollar Strong Again… Move Too Far?
The combination of a stronger US economy and possible rate hikes has reignited dollar bullishness. The dollar rose against most currencies during the second quarter and emerging market currencies were particularly hard hit.
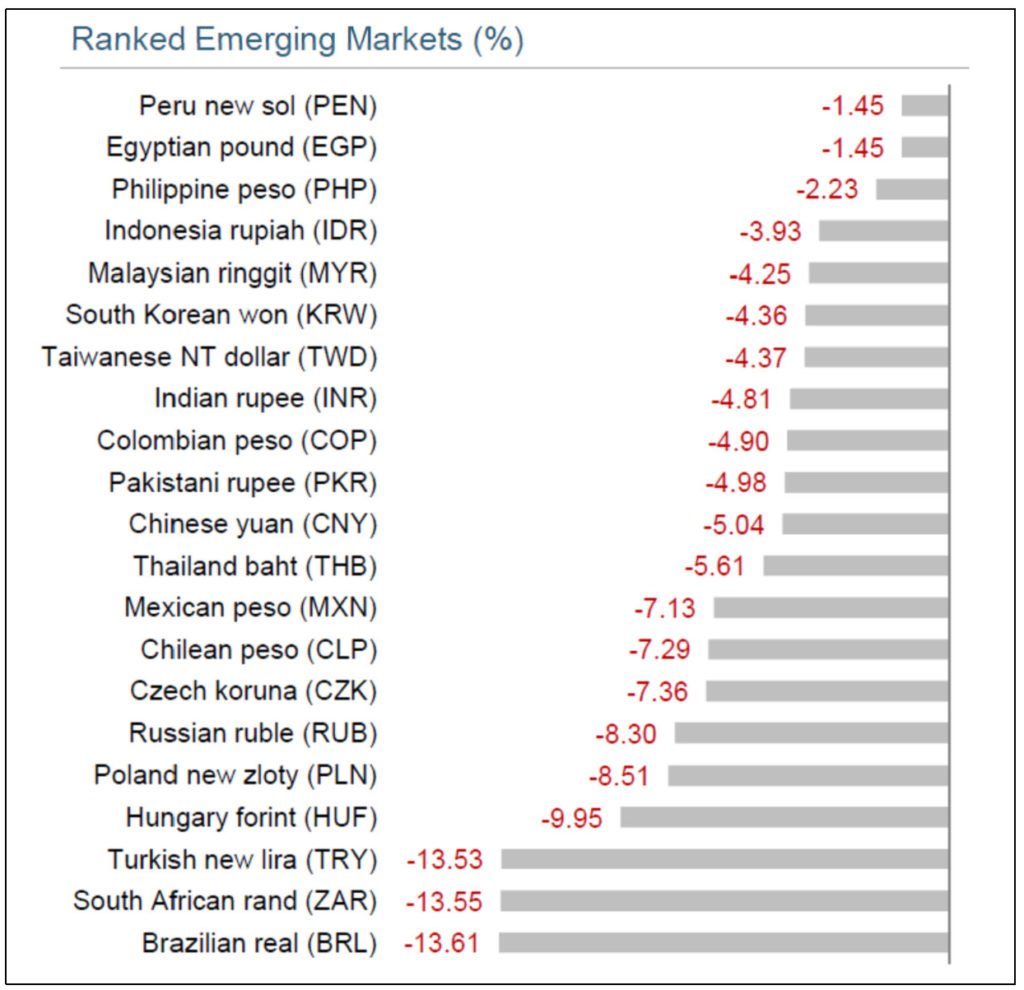
Source: MSCI Data
As we have discussed in past letters, long-term currency movements are nearly impossible to predict and uniform bullishness (in either direction) should therefore often be viewed skeptically. As luck would have it, we spent part of May in Brazil, just in time to experience a nationwide trucking strike while traveling with a four-year-old – one hasn’t truly lived until experiencing this type of car fun.
Our less than official sampling of opinions on the Brazilian macroeconomic environment would be pessimistic (to be kind), and this was before Brazil’s recent defeat to Belgium during the World Cup. But, this pessimism could offer some interesting investment opportunities, particularly as the trade concerns/dollar bullishness interact with elections and other geopolitical/economic events.
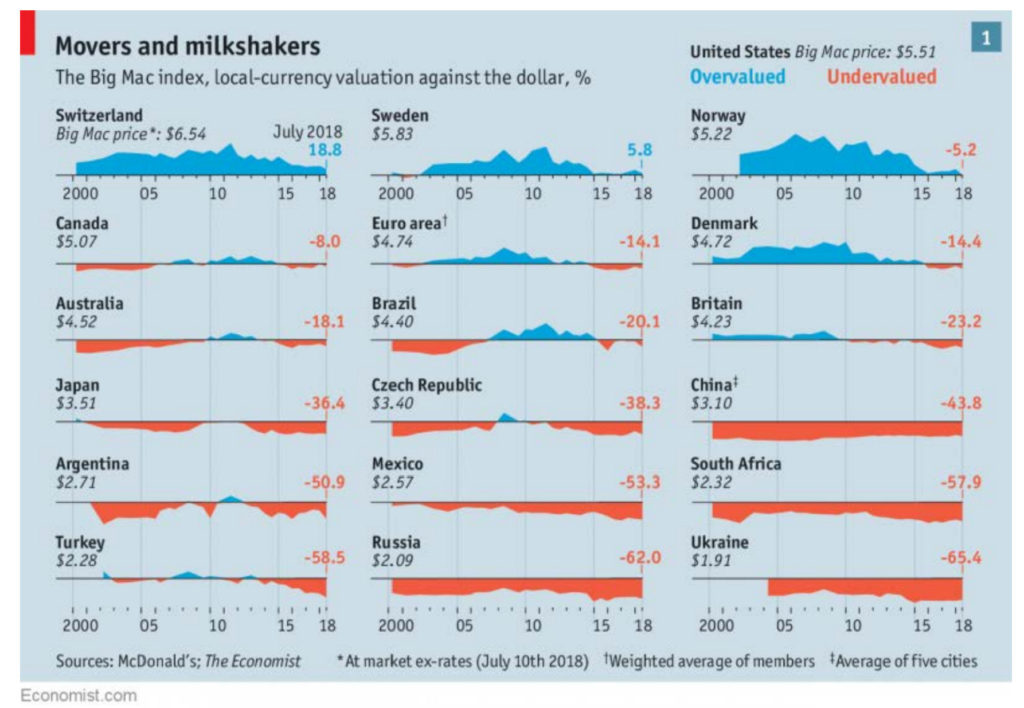
While far from an effective predictor of short-term results as overvalued often becomes more overvalued, the Economist’s Big Mac Index suggests that on a purchasing power basis[1], the dollar’s move has gone too far.
High Debt, Index Buying Pressure, Expensive Stocks – The More Things Change…
As for the other concerns (trade wars, recession, cycle risk), we are reminded of a Barron’s interview with value investing legend Seth Klarman sent to us by a close investing contact.
In the extensive interview, Klarman (with prodding from Barron’s) spent considerable time discussing high aggregate debt levels, high deal valuation levels, the role of index investing in driving up valuations and how the overwhelming number of stocks would still be unattractive even if they dropped anywhere from 25-33 percent. Certainly, not a bullish backdrop and don’t many of these issues sound familiar?
So, when was the interview? Earlier this year? 2016 or 2017? Actually in… 1991. It should be noted that the US was just coming out of recession at the time of the interview and Klarman spent a good portion of the remaining interview discussing several compelling ideas in what he thought was a tougher environment to find investments.
It is amazing to think about the number of politicians, economic cycles and geopolitical events that have occurred over the past 30 years, a period when the Dow Jones Industrial Average went from roughly 3,000 at the time of the interview in 1991 to over 25,000 today.
We are certainly not advocating that investors sport rose-colored glasses and blindly buy stocks. But, as we have stated in past letters, one of the few certainties of the investing process is constant economic uncertainty. Problems that seem unique often parallel with those from previous periods and this should be remembered before predicting future apocalypses.
[1] The basic idea of the Big Mac Index is that currencies should adjust until goods cost the same everywhere. If there is a variation in prices after converting Big Mac prices into dollars, one currency looks overvalued compared to another.
Disclaimer: BAM’s investment decision making process involves a number of different factors, not just those discussed in this document. The views expressed in this material are subject to ongoing evaluation and could change at any time. Past performance is not indicative of future results, which may vary. The value of investments and the income derived from investments can go down as well as up. It shall not be assumed that recommendations made in the future will be profitable or will equal the performance of the securities mentioned here. While BAM seeks to design a portfolio which reflects appropriate risk and return features, portfolio characteristics may deviate from those of the benchmark. Although BAM follows the same investment strategy for each advisory client with similar investment objectives and financial condition, differences in client holdings are dictated by variations in clients’ investment guidelines and risk tolerances. BAM may continue to hold a certain security in one client account while selling it for another client account when client guidelines or risk tolerances mandate a sale for a particular client. In some cases, consistent with client objectives and risk, BAM may purchase a security for one client while selling it for another. Consistent with specific client objectives and risk tolerance, clients’ trades may be executed at different times and at different prices. Each of these factors influences the overall performance of the investment strategies followed by the Firm. Nothing herein should be construed as a solicitation or offer, or recommendation to buy or sell any security, or as an offer to provide advisory services in any jurisdiction in which such solicitation or offer would be unlawful under the securities laws of such jurisdiction. The material provided herein is for informational purposes only. Before engaging BAM, prospective clients are strongly urged to perform additional due diligence, to ask additional questions of BAM as they deem appropriate, and to discuss any prospective investment with their legal and tax advisers.
This post by MOI Global instructor Phil Ordway has been excerpted from a letter of Anabatic Investment Partners, based in Chicago, Illinois.
Phil presented his in-depth investment theses on Armstrong (NYSE: AWI) and USG (NYSE: USG) at Best Ideas 2016. Replay here.
Armstrong (AWI) is performing well and should soon provide some clarity on its capital allocation plans. As noted in January, Armstrong has agreed to sell its international assets to German building products company Knauf. The sale should close this summer and bring $250 million of net cash to AWI. The allocation of that capital, along with the hundreds of millions of dollars of free cash flow the remaining business will generate over the next few years, will go a long way in determining our investment prospects.
Speaking of Knauf, it recently announced its purchase of USG, Armstrong’s U.S.-based competitor. Knauf plans to keep USG’s brand, strategy, headquarters, and operations. It seems unlikely – for now – that Knauf’s ownership will bring any material changes in competition from Armstrong’s perspective, but it bears watching.
Gross Long and Gross Short performance attribution for the month and year-to-date periods is based on internal calculations of gross trading profits and losses (net of trading costs), excluding management fees/incentive allocation, borrowing costs or other fund expenses. Net Return for the month is based on the determination of the fund’s third-party administrator of month-end net asset value for the referenced time period, and is net of all such management fees/incentive allocation, borrowing costs and other fund expenses. Net Return presented above for periods longer than one month represents the geometric average of the monthly net returns during the applicable period, including the Net Return for the month referenced herein. An investor’s individual Net Return for the referenced time period(s) may differ based upon, among other things, date of investment. In the event of any discrepancy between the Net Return contained herein and the information on an investor’s monthly account statement, the information contained in such monthly account statement shall govern. All such calculations are unaudited and subject to further review and change. For purposes of the foregoing, the calculation of Exposure Value includes: (i) for equities, market value, and (ii) for equity options, delta-adjusted notional value.
THE INFORMATION PROVIDED HEREIN IS CONFIDENTIAL AND PROPRIETARY AND IS, AND WILL REMAIN AT ALL TIMES, THE PROPERTY OF ANABATIC INVESTMENT PARTNERS LLC, AS INVESTMENT MANAGER, AND/OR ITS AFFILIATES. THE INFORMATION IS BEING PROVIDED SOLELY TO THE RECIPIENT IN ITS CAPACITY AS AN INVESTOR IN THE FUNDS OR PRODUCTS REFERENCED HEREIN AND FOR INFORMATIONAL PURPOSES ONLY. THE INFORMATION HEREIN IS NOT INTENDED TO BE A COMPLETE PERFORMANCE PRESENTATION OR ANALYSIS AND IS SUBJECT TO CHANGE. NONE OF ANABATIC INVESTMENT PARTNERS LLC, AS INVESTMENT MANAGER, THE FUNDS OR PRODUCTS REFERRED TO HEREIN OR ANY AFFILIATE, MANAGER, MEMBER, OFFICER, EMPLOYEE OR AGENT OR REPRESENTATIVE THEREOF MAKES ANY REPRESENTATION OR WARRANTY WITH RESPECT TO THE INFORMATION PROVIDED HEREIN. AN INVESTMENT IN ANY FUND OR PRODUCT REFERRED TO HEREIN IS SPECULATIVE AND INVOLVES A HIGH DEGREE OF RISK. THERE CAN BE NO ASSURANCE THAT THE INVESTMENT OBJECTIVE OF ANY SUCH FUND OR PRODUCT WILL BE ACHIEVED. MOREOVER, PAST PERFORMANCE SHOULD NOT BE CONSTRUED AS A GUARANTEE OR AN INDICATOR OF THE FUTURE PERFORMANCE OF ANY FUND OR PRODUCT. AN INVESTMENT IN ANY FUND OR PRODUCT REFERRED TO HEREIN CAN LOSE VALUE. INVESTORS SHOULD CONSULT THEIR OWN PROFESSIONAL ADVISORS AS TO LEGAL, TAX AND OTHER MATTERS RELATING TO AN INVESTMENT IN ANY FUND OR PRODUCT. THIS IS NOT AN OFFER TO SELL OR SOLICITATION OF AN OFFER TO BUY AN INTEREST IN A FUND OR PRODUCT. ANY SUCH OFFER OR SOLICITATION WILL BE MADE ONLY BY MEANS OF DELIVERY OF A FINAL OFFERING MEMORANDUM, PROSPECTUS OR CIRCULAR RELATING TO SUCH FUND AND ONLY TO QUALIFIED INVESTORS IN THOSE JURISDICTIONS WHERE PERMITTED BY LAW. ALL FUND OR PRODUCT PERFORMANCE, ATTRIBUTION AND EXPOSURE DATA, STATISTICS, METRICS OR RELATED INFORMATION REFERENCED HEREIN IS ESTIMATED AND APPROXIMATED. SUCH INFORMATION IS LIMITED AND UNAUDITED AND, ACCORDINGLY, DOES NOT PURPORT, NOR IS IT INTENDED, TO BE INDICATIVE OR A PREDICTOR OF ANY SUCH MEASURES IN ANY FUTURE PERIOD AND/OR UNDER DIFFERENT MARKET CONDITIONS. AS A RESULT, THE COMPOSITION, SIZE OF, AND RISKS INHERENT IN AN INVESTMENT IN A FUND OR PRODUCT REFERRED TO HEREIN MAY DIFFER SUBSTANTIALLY FROM THE INFORMATION SET FORTH, OR IMPLIED, HEREIN. PERFORMANCE DATA IS PRESENTED NET OF APPLICABLE MANAGEMENT FEES AND INCENTIVE FEES/ALLOCATION AND EXPENSES, EXCEPT FOR ATTRIBUTION DATA, TO THE EXTENT REFERENCED HEREIN, OR AS MAY BE OTHERWISE NOTED HEREIN. NET RETURNS, WHERE PRESENTED HEREIN, ASSUME AN INVESTMENT IN THE APPLICABLE FUND OR PRODUCT FOR THE ENTIRE PERIOD REFERENCED. AN INVESTOR’S INDIVIDUAL PERFORMANCE WILL DIFFER BASED UPON, AMONG OTHER THINGS, THE FUND OR PRODUCT IN WHICH SUCH INVESTMENT IS MADE, THE INVESTOR’S “NEW ISSUE” ELIGIBILITY (IF APPLICABLE), AND DATE OF INVESTMENT. IN THE EVENT OF ANY DISCREPANCY BETWEEN THE INFORMATION CONTAINED HEREIN AND THE INFORMATION IN AN INVESTOR’S MONTHLY ACCOUNT STATEMENT IN RESPECT OF THE INVESTOR’S INVESTMENT IN A FUND OR PRODUCT REFERRED TO HEREIN, THE INFORMATION CONTAINED IN THE INVESTOR’S MONTHLY ACCOUNT STATEMENT SHALL GOVERN. NOTE ON INDEX PERFORMANCE: INDEX PERFORMANCE DATA AND RELATED METRICS, TO THE EXTENT REFERENCED HEREIN, ARE PROVIDED FOR COMPARISON PURPOSES ONLY AND ARE BASED ON (OR DERIVED FROM) DATA PUBLISHED OR PROVIDED BY EXTERNAL SOURCES. THE INDICES, THEIR COMPOSITION AND RELATED DATA GENERALLY ARE OWNED BY AND ARE PROPRIETARY TO THE COMPILER OR PUBLISHER THEREOF. THE SOURCE OF AND AVAILABLE ADDITIONAL INFORMATION REGARDING ANY SUCH INDEX DATA IS AVAILABLE UPON REQUEST.
This article is excerpted from a letter by Alain Robitaille, head of Le Groupe Robitaille at Desjardins Securities, based in Quebec, Canada.
Sale of Pepsico
We sold our shares of this well-known company that we have held since January 26, 2009. This investment has yielded a respectable return, at an average annual compound rate approximating 11.36% (including dividends and exchange rate effects). The annualized return of our portfolio for the same period was 16.16%.
We consider the company somewhat expensive in relation to its growth, so we opted to invest elsewhere. Pepsico Inc. is an interesting laboratory to track the evolution of a company that has to adapt to the evolution of its customers.
Soft drinks, formerly so popular, have fallen out of favour with campaigns targeting obesity. The company has skillfully diversified into water, juices and snacks, but has difficulty outweighing the decline in sweetened beverages. We intend to continue monitoring its trajectory.
Partial sale of Wells Fargo
We trimmed our position in this company by 22% to generate cash so we can buy something else. Wells still accounts for about 4.5% of our equity portfolio. The average annual return on this investment since our first purchase in January 2009 is roughly 17.29%. Satisfactory and slightly above portfolio performance.
Sale of Darling Ingredients
We sold Darling primarily to generate liquidity for another purchase. Part of our holdings for only 20 months, this producer of ingredients and biofuels from the recovered slaughterhouse waste yielded us approximately 8.5% per year on average, slightly overperforming the portfolio (7.84%) for the same period.
Sale of Boston Beer Co
We also sold Boston Beer to generate liquidity for a purchase. This company, a pioneer in microbrewed beer, is a victim of its own success, in a way. The market is now flooded with a high number of new beers from a multitude of producers. With the trendy effect impacting sales volumes, we sold at essentially the same price we had paid.
This sale is the subject of a running gag in the team, because Fanie isn’t very fond of this company, which I bought as part of the small-cap model at the outset. Now that she’s the manager, she decided (with my support) to sell SAM. Why can’t Fanie stop talking about a stock she sold? Well, it’s because the value of the company went up by more than 50% within three months of the sale! She’s really unhappy about it. When she brings it up, I remind her that I was fond of the company. I also have stories like this one to tell, but I’m going to spare you since I’m the one writing this letter
Disclaimer: None of these returns take management fees into account. This data represents past performance and does not guarantee future results. This newsletter may contain statistical data cited from third party sources we believe to be reliable. Desjardins Securities makes no claim regarding the accuracy or completeness of the statistic information obtained, and readers should not rely on it in this respect. Alain Robitaille and Fanie Ouellet are registered as portfolio managers with self-regulatory organizations. They are authorized under the provisions of Rule 1300 of the Investment Industry Regulatory Organization of Canada (IIROC) to make investment decisions and provide advice on securities for managed accounts. Aside from Alain Robitaille and Fanie Ouellet, no member of Robitaille Group can exercise discretionary power over a client’s account, approve discretionary orders for a managed account or contribute to investment decisions taken on behalf of a managed account holder or to advice given with respect to such an account. Each of the Desjardins Securities advisors named on the front page or at the beginning of any section of this document confirms that the recommendations and opinions expressed within accurately reflect the personal opinions of the advisors with respect to the company and the securities discussed in this document, as well as any other company or security monitored by the advisor that is mentioned in this document. Desjardins Securities may have previously published other opinions, including ones contrary to those expressed herein. Such opinions reflect the different points of view, assumptions and analysis methods of the advisors who authored them.
NOTA DEL EDITOR: La siguiente idea de inversión, escrito por Jean Philippe Tissot, miembro de MOI Global, es extraída de la carta anual 2017 de Tissot Ayram Family Partnership.
* * *
2017 fue otro año de resultados extraordinarios para MGP Ingredientes [MGPI]. Ver la transformación radical de MGPI en los últimos años me hace sentir orgulloso de las personas que impulsan este cambio. El CEO de MGP, Gus Griffin, ha demostrado increíbles habilidades de liderazgo. Ha dado demasiado en cada objetivo que ha establecido para MGPI, todo mientras se enfoca en el largo plazo. Esta es una habilidad muy rara en los gestores; desde el primer día, ha sacrificado los resultados a corto plazo por los sostenibles a largo plazo.
En 2017, MGPI incrementó sus ventas netas un 9.7%, impulsadas por un incremento de 18.4% en las ventas de alcohol premium. Las ventas de productos Brown (whisky) aumentaron un 25%. La ganancia bruta incrementó 16.4% y los beneficios por acción aumentaron 34% (el crecimiento de los beneficios por acción incluye uno positivo extraordinario), todo esto mientras invertía en ventas y mercadotecnia y ampliaba considerablemente su inventario de whisky en un 29% a US$65.7 millones en 2017.
Continue reading »
Losing Our Marbles — Why We Have a Concentrated Portfolio
July 28, 2018 in Equities, Featured, Letters, Portfolio Management, SkillsThis article by Michael Lee is excerpted from a letter of Hypotenuse Capital.
Perhaps you have wondered why our Partnership has such a concentrated investment approach (currently, our five largest investments constitute about 65% of the Fund’s net assets). I want to spend some time discussing why we do not diversify as much as other investment funds; I believe this is an important aspect of our investment strategy.
Our Fund aims to outperform the broader equity marketplace over long periods of time and the only way to do that is by selecting a subset of the market that we believe will outperform the average. In other words, if one is trying to outperform the S&P 500 Index, one cannot do so by owning all 500 stocks in the index but only by selecting some subset of that index. This is, of course, an obvious truism, but it is an important starting point for reasons that should become clearer below.
The chart below illustrates the performance of the S&P 500 components over the twelve months ended June 30, 2018 by decile.
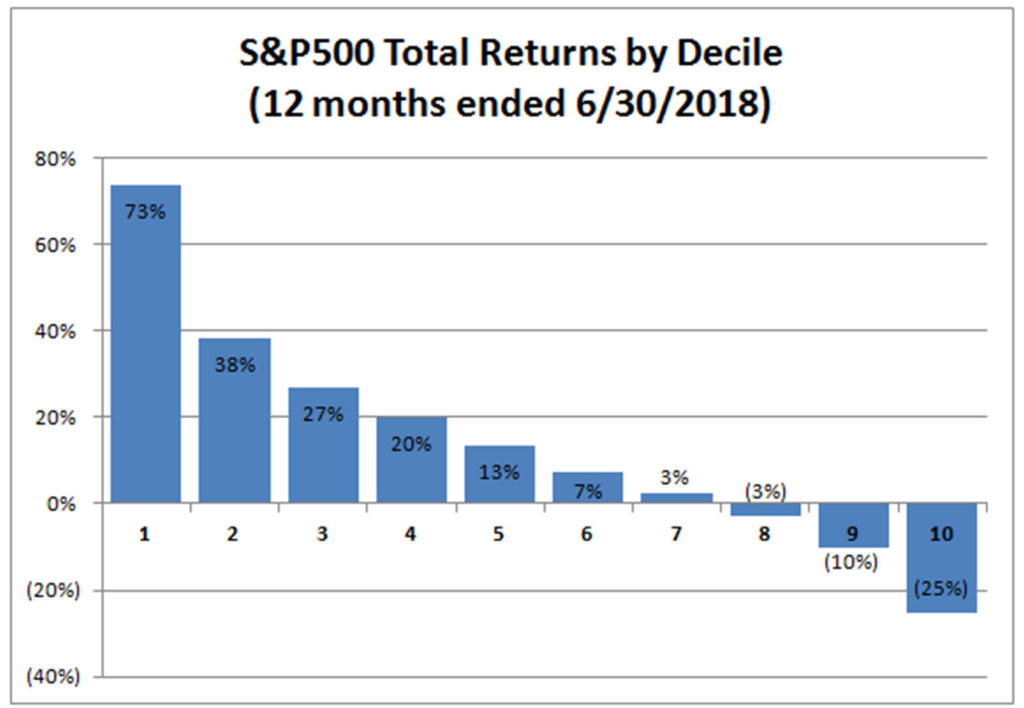
Source: CapitalIQ and Hypotenuse Capital analysis
Now, it seems reasonable that if one wants to assemble a portfolio that outperforms the index, one has to select a portfolio of securities with as many individual selections from the left hand side of the chart, i.e., the first five deciles, and as few as possible from the bottom five deciles or the right hand side of the chart. How hard is it to pick a portfolio of stocks from a given part of the chart, say just the top decile?
 To get at this question we can turn back to a little bit of probabilistic math that we all learned (or at least “were taught”) in high school. We can reframe the question like the “marbles in a bag” probability problems you may remember from back then. For example, imagine that you have a paper bag filled with 500 marbles of which 50 are red and all the other marbles are blue. If you reach into the bag and draw a marble at random, what are the odds that it will be red (i.e., top decile)? In this scenario, the math works out relatively simply to 10% or one out of every ten attempts.
What happens to our odds if we reach into the bag and randomly select two marbles? What are the odds that both marbles will be red? What happens if we select ten marbles? The math starts to get a little complicated and involves combinations and factorials, but I will spare you the detailed algebra. The probability of drawing two marbles that are both red are about 1% or one in a hundred. The probability of drawing ten marbles at random and having them all be red is about one in one hundred billion. Statistically speaking, you are more likely to win the lottery than you are to randomly pick ten red marbles from this bag or ten top decile stocks from the index.
Table 1: Odds of a Randomly Selected Portfolio Being All Top Decile Stocks Based on Portfolio Size (n)
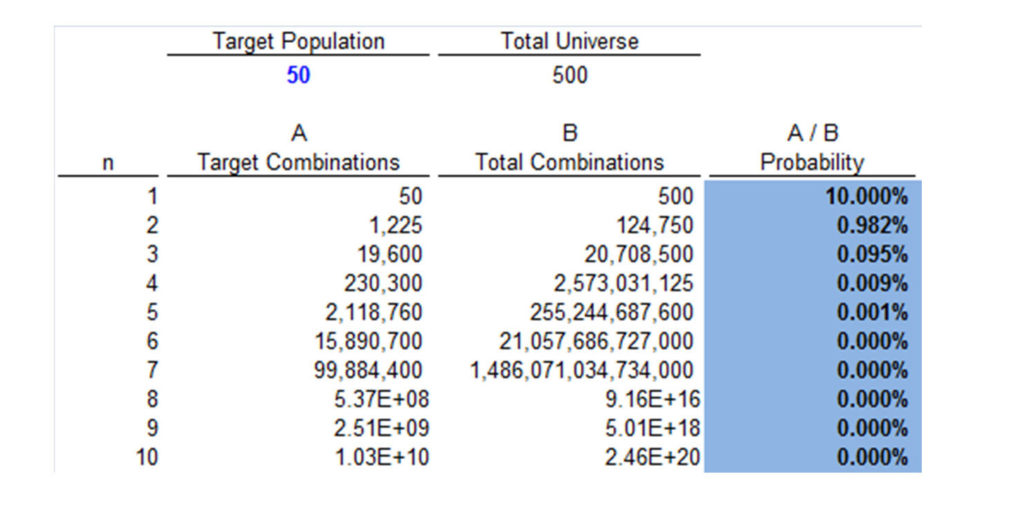
You might note in the table above that the odds of getting all red marbles get worse as you increase the number of marbles (n) you draw from the bag. This is somewhat intuitive; you are more likely to flip a coin and get heads once than you are to flip a coin ten times and get ten heads in a row. It is important to notice that the odds not only get worse, they get worse very rapidly. The probability of drawing all red marbles decays exponentially, not linearly, with increasing (n).
One can improve the odds by changing some parameters. For example, if one was just targeting “above average” performance of stocks, that would be like assuming that 250 marbles in the bag of 500 were red marbles. In this case, the odds of drawing 10 red marbles are about one in one thousand. However, changing this parameter means accepting lower returns and therefore takes us farther away from our goal of outperforming the index. Ultimately, the number of stocks in a portfolio (n) is one of the most important drivers of the probability that that portfolio can outperform the index. Consequently, ceteris paribus, concentrated portfolios are more likely to outperform the index than are diversified ones.
The tradeoff here, of course, is variance. A single stock “portfolio” where the only investment files for bankruptcy is obviously a huge disaster whereas a portfolio made up of one hundred equally sized investments will not suffer nearly as greatly if any one of those investments fares badly. Hence, many investors have a natural and understandable inclination to diversify their portfolios and mitigate the risk of anything going wrong with any single investment. However, risk and returns go hand in hand; the more one diversifies a portfolio, the less likely it is to outperform the index. Trying to outperform the index with a broadly diversified portfolio is a Herculean task that runs counter to the fundamental principles of mathematics; it is a bit like trying to land a rocket on Mars without factoring in gravity.
Fortunately, when it comes to picking stocks, we don’t have to pick blindly from a bag of marbles. The world of stocks and investing is rich with information and, practically speaking, there is a limitless amount of data that one can use to research the companies, products, and people behind stocks. It should be possible to use this vast amount of data and information to analyze stocks and identify which ones are more likely to perform well than not, thus allowing us to filter out blue marbles from the bag and increasing our odds of picking red marbles.
 The question then becomes, what protocol or algorithm does one use to screen out all the blue marbles and keep the red ones? This is a crucial factor for investing success. If it was as simple as just buying stocks that went up in the past, then success in investing would be a trivial matter; everyone would be able to do it. I have found that many “fundamental” investment analysts spend a lot of time obsessing over short-term changes in a company’s financial performance. They ask CEOs why revenue is going up or down in a particular quarter, or why profit margins are going up or down. The issue with these types of questions is that they focus on the symptoms and outcomes of business performance but not the core causes. Growth and margins are indicators of business health but not the cause of good business health itself. If we want to identify stocks that will perform well, we should seek to identify the root cause of what makes those stocks successful.
Although there are many reasons why a stock might go up, I would like to propose a simple framework that I believe will lead to a higher probability of success in stocks. I believe that stocks tend to perform well when the underlying business is thriving. This implies that the business has satisfied customers who purchase its products and/or services. This would suggest that the company offers high quality products and services at compelling prices. A company is more likely to provide good products and services if it has passionate employees who care about the customer and the quality of their work. It is easier to recruit and retain such employees when there is a strong team culture that promotes engagement and collaboration amongst its members. A strong culture is often the handiwork of an exceptional and visionary leader who sets the tone for the organization and gets everyone moving in the same direction.
This “root cause analysis” for successful investing is simple and perhaps rudimentary. Yet, in my years in finance and investing I have come across very few people in the securities industry who think this way. Nonetheless, I find it difficult to imagine that if one follows this line of logic and invests accordingly that the outcome will be disappointing over long periods of time. For this reason, the Hypotenuse Capital mission is “To find outstanding companies led by exceptional individuals and invest intelligently in them.”
By focusing on companies that have strong leaders and cultures, we hope to identify businesses that have the best chances of thriving over the long run. In other words, we think these kinds of businesses are most likely to be the red marbles in the bag that lead to superior investment performance over time.
 Importantly, the marble in the bag problem is compounded by portfolio turnover. Picking a new stock portfolio is like putting all the marbles in the bag again and trying to pick 10 red ones from scratch. Hence, higher frequency turnover reduces the odds of producing good results. Consequently, we aim to make long duration investments and change them infrequently; we’re trying to pick businesses that will do well not just over the next day, quarter or year, but over three, five or even thirty years. We focus on finding businesses with long runways for future growth. We look for companies with durable competitive advantages that help them widen the gap between them and their competition over time. Cheetahs are the fastest sprinters on the planet but only over short distances. Gazelles can survive cheetah attacks because they are more nimble and can outlast a cheetah running over long distances. We’re looking for gazelles.
 Furthermore, we use our research to screen out potential disasters. For example, by avoiding companies with high levels of debt we can reduce the risk of insolvency and bankruptcy as an outcome in our investment portfolio. We look for management teams with high integrity and who treat their employees, suppliers and customers well. When all the stakeholders in a business benefit, everyone wants the business to succeed. Conversely, companies that treat their employees, suppliers or customers poorly attract competition, lawsuits, and regulators, i.e., things that imperil companies; so we avoid companies that behave in these ways. Through careful selection, we can mitigate the risks inherent in investing in a concentrated portfolio. We can’t eliminate the risk of short-term volatility of any single security in our portfolio but we can minimize the risk of permanent capital impairment from any one given investment.
There are some natural implications of our approach to investing. Our process yields a very limited number of investable ideas at any given point in time. Consequently, we expect ourselves: (a) to be extremely patient and wait for “fat pitches” and, (b) to swing with conviction when those pitches come. We would rather invest in a single exceptional idea than spread ourselves thinly over a hundred marginal ones. Our returns have been and will be volatile. I believe that, if we stick to this approach consistently, the results will be very satisfactory over time.
Disclaimer: THE INFORMATION PRESENTED HEREIN REPRESENTS THE VIEWS OF HYPOTENUSE CAPITAL MANAGEMENT, LLC (“HCM”) AND IS NOT TO BE CONSIDERED INVESTMENT ADVICE. NOTHING HEREIN SHOULD BE CONSIDERED A RECOMMENDATION TO PURCHASE OR SELL ANY PARTICULAR SECURITY OR OTHER FINANCIAL INSTRUMENT. THERE CAN BE NO ASSURANCE THAT ANY SECURITIES DISCUSSED HEREIN WILL REMAIN IN HYPOTENUSE CAPITAL PARTNERS, LP’S (THE “FUND”) PORTFOLIO OR, IF SOLD, WILL NOT BE REPURCHASED. FURTHERMORE, HCM MAY SEEK TO ADD TO THE FUND’S POSITIONS IN THE SECURITIES DISCUSSED HEREIN, OR HEDGE AGAINST SUCH POSITIONS. THE SECURITIES DISCUSSED IN THIS DOCUMENT DO NOT REPRESENT THE FUND’S ENTIRE PORTFOLIO AND MAY REPRESENT ONLY A SMALL PERCENTAGE OF THE FUND’S PORTFOLIO HOLDINGS. IT SHOULD NOT BE ASSUMED THAT THE HOLDINGS DISCUSSED IN THIS DOCUMENT HAVE BEEN OR WILL BE PROFITABLE, OR THAT RECOMMENDATIONS MADE IN THE FUTURE WILL BE PROFITABLE OR WILL EQUAL THE INVESTMENT PERFORMANCE OF THE SECURITIES DISCUSSED HEREIN. MOREOVER, THE RISK LIMITS AND HEDGES ON THE POSITION ARE NOT DISCLOSED. THIS DOCUMENT, WHICH IS BEING PROVIDED ON A CONFIDENTIAL BASIS, SHALL NOT CONSTITUTE AN OFFER TO SELL OR THE SOLICITATION OF ANY OFFER TO BUY WHICH MAY ONLY BE MADE AT THE TIME A QUALIFIED OFFEREE RECEIVES A CONFIDENTIAL PRIVATE OFFERING MEMORANDUM (THE “MEMORANDUM”) OF THE FUND, WHICH CONTAINS IMPORTANT INFORMATION (INCLUDING INVESTMENT OBJECTIVE, POLICIES, RISK FACTORS, FEES, TAX IMPLICATIONS AND RELEVANT QUALIFICATIONS), AND ONLY IN THOSE JURISDICTIONS WHERE PERMITTED BY LAW. IN THE CASE OF ANY INCONSISTENCY BETWEEN THE DESCRIPTIONS OR TERMS IN THIS DOCUMENT AND THE MEMORANDUM, THE MEMORANDUM SHALL CONTROL. THESE SECURITIES SHALL NOT BE OFFERED OR SOLD IN ANY JURISDICTION IN WHICH SUCH OFFER, SOLICITATION OR SALE WOULD BE UNLAWFUL UNTIL THE REQUIREMENTS OF THE LAWS OF SUCH JURISDICTION HAVE BEEN SATISFIED. THIS DOCUMENT IS NOT INTENDED FOR PUBLIC USE OR DISTRIBUTION. WHILE ALL THE INFORMATION PREPARED IN THIS DOCUMENT IS BELIEVED TO BE ACCURATE, HCM MAKES NO EXPRESS WARRANTY AS TO THE COMPLETENESS OR ACCURACY, NOR CAN IT ACCEPT RESPONSIBILITY FOR ERRORS, APPEARING IN THE DOCUMENT. AN INVESTMENT IN THE FUND IS SPECULATIVE AND INVOLVES A HIGH DEGREE OF RISK. OPPORTUNITIES FOR WITHDRAWAL/REDEMPTION AND TRANSFERABILITY OF INTERESTS ARE RESTRICTED, SO INVESTORS MAY NOT HAVE ACCESS TO CAPITAL WHEN IT IS NEEDED. THERE IS NO SECONDARY MARKET FOR THE INTERESTS AND NONE IS EXPECTED TO DEVELOP. AN INVESTOR SHOULD NOT MAKE AN INVESTMENT, UNLESS IT IS PREPARED TO LOSE ALL OR A SUBSTANTIAL PORTION OF ITS INVESTMENT. THE FEES AND EXPENSES CHARGED IN CONNECTION WITH THIS INVESTMENT MAY BE HIGHER THAN THE FEES AND EXPENSES OF OTHER INVESTMENT ALTERNATIVES AND MAY OFFSET PROFITS. THERE IS NO GUARANTEE THAT THE INVESTMENT OBJECTIVE OF THE FUND WILL BE ACHIEVED. MOREOVER, THE PAST PERFORMANCE (IF ANY) OF THE INVESTMENT TEAM SHOULD NOT BE CONSTRUED AS AN INDICATOR OF FUTURE PERFORMANCE. ANY PROJECTIONS, MARKET OUTLOOKS OR ESTIMATES IN THIS DOCUMENT ARE FORWARD LOOKING STATEMENTS AND ARE BASED UPON CERTAIN ASSUMPTIONS. OTHER EVENTS WHICH WERE NOT TAKEN INTO ACCOUNT MAY OCCUR AND MAY SIGNIFICANTLY AFFECT THE RETURNS OR PERFORMANCE OF THE FUND. ANY PROJECTIONS, OUTLOOKS OR ASSUMPTIONS SHOULD NOT BE CONSTRUED TO BE INDICATIVE OF THE ACTUAL EVENTS WHICH WILL OCCUR. ANY PROJECTIONS, MARKET OUTLOOKS OR ESTIMATES IN THIS DOCUMENT ARE FORWARD LOOKING STATEMENTS AND ARE BASED UPON CERTAIN ASSUMPTIONS. ANY PROJECTIONS, OUTLOOKS OR ASSUMPTIONS SHOULD NOT BE CONSTRUED TO BE INDICATIVE OF THE ACTUAL EVENTS WHICH WILL OCCUR.
My new (mini) book attempts to explain the financial foundations of fracking (say that fast!) and how our newfound energy riches might affect geopolitics. If interested (thank you if so!) ask about it here https://t.co/QmAl33zAHZ or preorder here. https://t.co/eY5rCDLY9Z pic.twitter.com/zDTni5W5o4
— Bethany McLean (@bethanymac12) July 26, 2018