This article is authored by MOI Global instructor Gaurav Aggarwal, co-founder and co-portfolio manager of Metis Opportunity Fund, based in Mauritius. Gaurav is an instructor at Best Ideas 2018, the fully online conference featuring more than one hundred expert instructors from the MOI Global membership community.
We recall very few investor meetings this year where the issue of India’s ‘expensive’ valuations didn’t come up. In a world where the vast majority of investors take a top-down approach while allocating capital. India often gets bundled within a highly heterogeneous basket of emerging markets, and its valuations, therefore, get benchmarked against an assorted universe of such markets.
Given that India’s headline PE multiple reflects a premium versus other emerging markets, it often appears as a richly valued investment destination in comparison to other markets. Comparing emerging markets via headline PE is similar to comparing two investment firms based on only assets under management.
Unfortunately, such an overly simplified observation ignores critical underlying factors such as the difference in industry representation within indices, and differentials in profitability, growth, capital intensity, and cash cycles across geographies.
Similarly, to compare such a headline multiple to how it trended historically is a forced simplification, if one is not taking profitability and cash cycle shifts into account. Just take Nifty 50 as an example. While Nifty’s revenue growth (ex-financials) has slowed considerably over the past five years, as compared to the prior 5-year period (9% versus 20%), it remains the fastest growing market among major emerging market peers. Its cash cycle has been slashed in half over the past five years (without compromising underlying profitability) as certain infrastructure and real estate constituents got replaced and working capital efficiency has broadly improved.
It is critical to provide an appropriate context when evaluating Nifty’s headline PE premium versus emerging market peers. The two vital areas one should stress upon are:
1. Industry composition differences. BRICS make up nearly half of MSCI Emerging Markets Index and little over 40% of the index if one excludes India. The low-teens PE multiple of MSCI Emerging Markets is therefore also suppressed by some of these markets where low PE industries make up most of their respective indices. More than half of China’s index constituents are financials while energy constituents have a similar weighting in Russia. A more relevant comparison, if one could call it that, would be an inter-industry comparison across these markets. While most Indian sectors still trade at a premium over EM peers, the overall valuation premium is particularly skewed by telecom, financials, industrials, and consumer discretionary sectors, which collectively comprise just under half of Nifty. In contrast, energy, which makes little under a fifth of Nifty, trades at a discount to emerging market peers. Sectors such as healthcare and materials meanwhile trade at 25-35% premium.
Exhibit 1 – Sector-wise 2017 P/E Comparison of Nifty vs. EM Peers
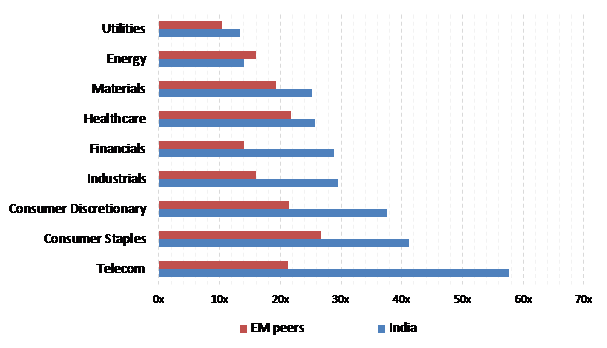
Note: All comparisons are made between constituents of the most liquid large cap index in respective markets. For China, FTSE China 50 index components were used. Other markets used for comparison here are BRICS, Indonesia, Malaysia, Poland, Korea, and Mexico.
2. More reliable earnings estimates: Our work across earnings announcements within emerging markets confirms that Nifty constituents report among the least differentials between actual earnings and estimates, lending more confidence to forward valuation multiples. This is a direct function of the number of estimates per company, and no emerging market benchmark components are as well covered as Nifty’s.
So, what should an ideal Nifty PE be?
When we create a sizeable intrinsic value framework at an index level, we are better positioned to provide an appropriate context to headline multiples. Based on such work, in our view, at current levels of growth and profitability, Nifty (ex-financials) 50’s ideal C2017 PE should lie in the 22-24x range, as compared to the current ~25x C2017 earnings. As we had mentioned earlier, one shouldn’t benchmark current headline multiple to how the index has traded previously since underlying fundamentals and constituents have shifted materially. However, if we were to benchmark India’s intrinsic value based multiple against arguably its most comparable BRICS peer, South Africa (on the basis of similarities within underlying growth, working capital intensity, underlying debt levels, profitability, and taxes) we conclude that Nifty50 (ex-financials) can support 45%+ premium over JSE FTSE Top-40 (ex-financials) versus the 25%+ it currently trades at.
In summary, we would discourage investors from reading too much into headline PE multiples without further evaluating differentials beyond headline earnings growth. While we wouldn’t categorize Indian large caps as cheap, we certainly aren’t in the camp that views Nifty 50 as particularly expensive in comparison to the emerging markets universe.
About The Author: Gaurav Aggarwal
Gaurav Aggarwal, CFA, CPA, CIPM is the co-founder and co-portfolio manager of Metis Opportunity Fund (MOF). Prior to starting Metis in 2011, he was a senior analyst with portfolio management duties over $50 million in fund of fund assets at a leading regional investment bank (Global Investment House) in the Middle East. Prior to this, he was with Bay Harbour Management, a $1.2 billion distressed debt and equity hedge fund in New York City. He has also served as an analyst with Polen Capital Management, a $8 billion+ long-only firm with a very successful long-term track record. He received an M.S. in Accounting (specializing in Finance) and B.S. in Business Administration from the University of North Carolina at Chapel Hill. He has publicly committed to create a charity corpus by initially allocating 10% of his annual share of earnings (management and incentive fees) from fund management. He will in the future then deploy this corpus to charity/cause of his choice.
More posts by Gaurav Aggarwal