Reflecting on our portfolio, and in the spirit of always continuing to refine our approach, we developed a mental model that we refer to as the “Quality Return Continuum.” The current continuum of the portfolio is shown in the graph below:
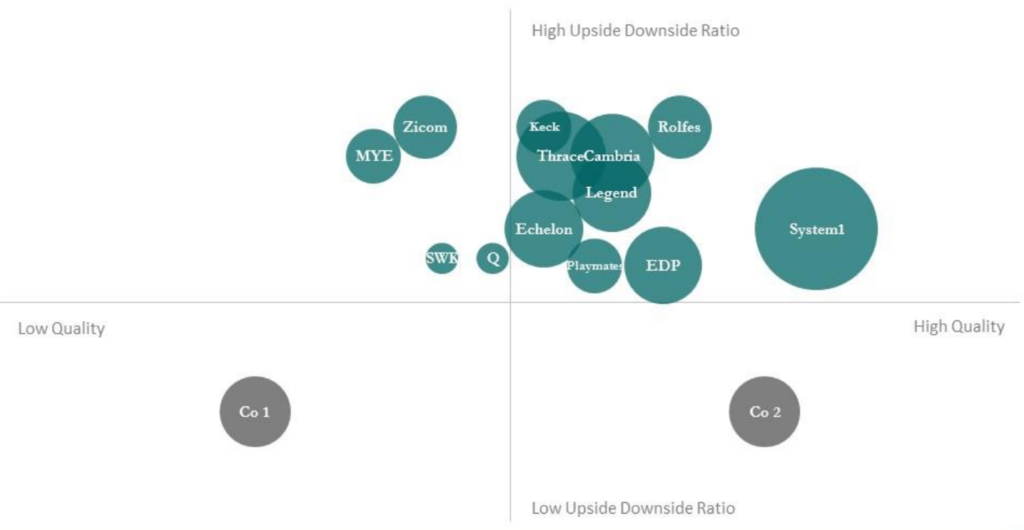
A few explanations may be in order. First, each axis is a continuum from low to high, with the middle of each axis representing “average.” So for example, “EDP” is pictured just above the horizontal axis with a slightly better-than-average Upside Downside Ratio (in this particular case, modest return potential is balanced by significant downside protection). Shares can fall below the horizontal axis and still have a positive expected return—though they would be exposed to above-average downside potential. Second, the size of each bubble shows the approximate portfolio allocation at the most recent quarter end. Third, the locations of each company on the graph are rough approximations, not mathematical certainties.
When we think about the “Upside Downside Ratio,” we think of it as the most important return consideration. It is not about absolute return alone. While we obviously seek to maximize upside in the names we add to the portfolio, we do so only in consideration of our estimate of their downside. So there are names in the portfolio in which our expected upside may be smaller than that of other names in the portfolio (or of other names we could add to the portfolio), but we judge their downside to be extremely well-protected.
When we think about “Quality” in the continuum, we think about a variable that encompasses several key characteristics, including:
- Returns on Capital (and sustainability)
- Management Capability
- Organic Growth / Reinvestment Opportunity
- Susceptibility to Business Cycles
- Risk of Technological Obsolescence
- Other Moat Considerations
In our minds, business quality is not simply a “yes or no” proposition. Business quality runs along a continuum between the extremes, and understanding approximately where it falls along the continuum is an important output of understanding a business. In turn, it is an important input in determining how to deploy capital across a portfolio, especially in a world in which above-average returns may not present themselves in one supposed category or another at a given time.
The Quality Return Continuum graph above shows the variability in portfolio company quality, as well as the above-average Upside Downside Ratio across the portfolio. We feel quite comfortable with the variability of quality, given that investment availability will vary depending on market conditions. While the intellectual approaches that we take to evaluate companies across the continuum may be different, they are also quite complementary. Along the quality spectrum, the unifying theme is that we consistently seek superior upside downside scenarios. While we construct the portfolio using a bottom-up search-and-analysis approach to finding ideas, our natural preference would be to display large circles in the upper right of the graph’s top-right quadrant (i.e., large allocations to high-quality businesses with high upside-versus-downside potential).
You’ll notice that when we own significant positions in businesses we consider to be of below-average quality, we demand an above-average upside downside scenario. (We note that Swick and Company Q are two situations that may not currently fit this mold—hence, their much smaller portfolio allocations. Company Q is a company we’ve been slowly exiting, and we’ll provide a further update on Swick in due course). In other cases, as currently is the case with System1 Group, the upside downside, while still above average, may not be what it once was (at our original purchase prices), but given the quality of the business, we are quite pleased to own shares at the current reduced upside downside ratio. This would likely not be the case had we judged the business to be much further to the left on the quality continuum. Where we clearly don’t want to be is in the grey circles in the chart, which are provided only as examples, not as companies that are in the portfolio. Below-average-quality businesses with below-average Upside Downside Ratios (e.g., “Co 1”) are a poor place to be; but it is important to also understand that above-average quality businesses can be priced to produce below-average expected Upside Downside Ratios, and we don’t want to be there either (e.g., “Co 2”).
One new bubble on the chart to which we would direct your attention is Rolfes Holdings Limited (Johannesburg: RLF). It is shown as an above-average-quality business with a much higher-than-average Upside Downside Ratio. This is our fund’s first investment in South Africa. Over the years, we’ve looked at a number of businesses in the country. Rolfes became our first investment there earlier this year after Matt visited the company toward the end of Q1, along with a number of other businesses and well-regarded local investors.
Rolfes is generally regarded as a specialty chemical company. In reality, the business is comprised of several manufacturing and distribution segments, each with their own characteristics: (1) agricultural chemicals; (2) food; (3) industrial chemicals; and (4) water. Even within each segment, depending on the line of business, there is quite a range of business quality. We believe the agricultural chemicals business is the highest-quality business, given the intellectual property and various other barriers to entry in that marketplace. The food business is a recent acquisition that is growing quite strongly, though over time it will almost certainly be a more competitive business. There are interesting pieces and aspects to each of the other two segments, with a fair degree of optionality in the water business, which has added significant new talent in the last eight months.
The company has been built by a series of acquisitions during the last 13 years, and we expect mergers and acquisitions (M&A) to be important going forward. While well-executed inorganic growth will help drive our returns over time, organic growth has been an important aspect of the business, and is an important piece of our interest in owning shares. We believe that annual organic revenue growth has averaged roughly 14% since 2006. Importantly, the M&A effort at the company does not ignore dilution; as a result, total revenue per share growth (organic and inorganic) has averaged 22% since 2005, and operating profit per share growth (organic and inorganic) has averaged 24% since 2006.
At acquisition, the market cap of the company was approximately R760 million (South African Rands) or R4.70 per share (US$ market cap would be approximately $57 million). The shares were trading at 7.5x trailing earnings and about 6.8x our estimate of FY 2017 earnings (June 30). While recognizing that Rolfes possesses differences in quality and scale relative to other chemical players in the local market, we find its earnings multiples to be completely anomalous. Rolfes also appears to be misvalued when comparing it to a broad spectrum of South African public companies. When we began to buy shares, profitable small-cap companies in the country were trading at 17x earnings, and collectively had showed poorer revenue growth and return on capital (ROC).
We have sized the Rolfes position to reflect a number of concerns and the fact that this is our first investment in the country. Currency is a major problem that cannot be cost-effectively hedged during our anticipated holding period. Since the end of Apartheid, the currency has depreciated against the dollar by approximately 6% per year. We have invested expecting such a drag going forward. Politics is another major concern. Corruption is a problem, and the current president and other government officials are making a variety of decisions or have hinted at decisions that are not in the long-term best interests of the nation. This includes issues around leadership succession.
Nonetheless, we expect Rolfes to perform well during the next several years. The end of a major drought, which has impacted the agricultural business; further growth in the foods business; expansion of the water business under new leadership; export growth; and additional M&A activity all provide the potential for meaningful growth in per-share earnings and the possibility of multiple expansion. In such a scenario, we expect the returns to be highly attractive.
This post has been excerpted from a letter to partners of Boyles Asset Management.
About The Author: Boyles Asset Management
Boyles Asset Management, run by Matthew Miller and Joseph Koster, launched an investment fund launched in May 2013. It is inspired by the Buffett Partnerships of the 1950s and 1960s. Boyles Asset Management believes in pay for performance. Matthew and Joseph have structured their fund so that incentive fees are dependent on strong and enduring performance for investors. The Boyles philosophy is deeply rooted in value investing and is complemented by a patient, long-term mindset and investment process. The investment mandate is broad, though Matt and Joe operate with a particular focus on the equity of small and micro-capitalization companies. They participate in markets both in the United States and in select international territories.
More posts by Boyles Asset Management