This article is authored by MOI Global instructor Scott Phillips, a principal and portfolio manager at Templeton and Phillips Capital Management. Scott is an instructor at Best Ideas 2018, the fully online conference featuring more than one hundred expert instructors from the MOI Global membership community.
After years of watching value managers lose ground to more popular investment strategies, including passive ETFs, as well as the growth and momentum styles, we believe it seems likely that the overall number of value investors populating the market has ebbed over this time-period. In an industry where the majority of practitioners show a preference to blend-in based on existential considerations this phenomenon should not only be expected, but seen as an ideal source of opportunity for the steadfast bargain hunter. Ironically, the industry-wide pursuit of convention, and the misplaced satisfaction found in rising near-term performance measures eventually coalesces into higher levels of risk.
From our perspective, the circumstances described above, and the opportunities they create exist today. The popularity of ETFs and strategies embracing growth and momentum has in our opinion created a situation where the tail is wagging the dog. Our first observation is that the shares most commonly held among ETFs carry materially higher valuation multiples relative to the market index. To understand the effect of ETFs herding into a rather narrow basket of equities, we looked at the average valuation for the 150 most commonly held stocks among ETFs to learn if these stocks traded at a premium to the rest of the market. Indeed, we found that the top 150 stocks held among ETFs trade at an average P/E of 31.1x compared with 16.7x in the MSCI ACWI Total Return Index for global stocks. Moreover, even when we remove the so-called FAANG stocks, the average only declines to 30.2x.
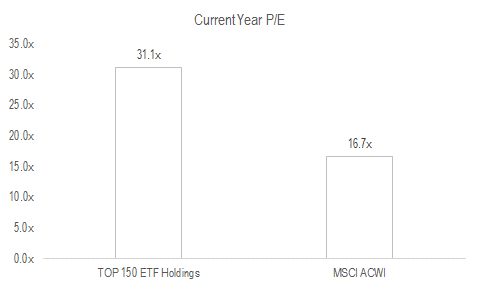
Source: etfdb.com, Templeton and Phillips Capital Management, LLC.
Our second observation on this phenomenon is joined at the hip with our first observation. We see the second risk component that investors are overlooking as a thinly veiled correlation among the majority of ETFs. Given the rapidly growing number of ETFs in the market, these funds tend to increasingly hold the same set of stocks in common.
Let us take Apple as an example. As you know, Apple is one of the largest tech companies, and to clarify, one that we generally view favorably for a long-term investor. However, by our count, Apple is now held by 155 ETFs. Notably, among these ETFs we find some odd-couple strategies cohabitating Apple that contradict each other. For instance, Apple is held by six value ETFs, five momentum ETFs, and ten growth ETFs. While we can argue that a growth company like Apple can fall out of favor and become a value, the contrast between value and momentum is too stark. We suspect if investors in the Deep Value ETF (DVP) knew they were commingling in a stock with the Powershares Momentum Portfolio (PDP), they might take issue.
This raises the important question, why are these disparate buyers trafficking in the same stocks? The answer we believe is liquidity. ETFs must find highly liquid stocks that make the purchase and redemption of shares-in-kind a fluid process for the ETF manager. This helps explain to us why the Catholic Values ETF (CATH) also owns Apple, even though Apple has historically been linked to child labor in the cobalt mines within its supply chain. We believe CATH, like all other ETFs requires liquid stocks in its portfolio, forcing it to make concessions on its investment mandate and hold stocks that are much like, if not the same as the remainder of its ETF brethren.
We believe when enough ETFs crowd into the same stocks, the ETF investor innocently picks up correlation across their portfolio (which undercuts the benefit of diversification). This erosion can occur irrespective of the ETF’s name, or its purported strategy. Interestingly, these risk-correlation circumstances surrounding ETFs seem mindful of investor complacency leading up to 2008, as it related to CDOs and other debt instruments.
Back then, we believe investors became complacent to underlying risk following years of rising asset prices. At that time, the individual debt positions these instruments held was often mislabeled and increasingly correlated due to the extreme loosening of credit standards across the board. This risk dynamic flourished and spread as investors were either not paying attention to, or did not understand the underlying risk. To be sure, we are not “against” ETFs in principal but rather, we see their popularity creating an unrecognized risk in the market.
Putting it all together, we see potential danger for these investors as we suspect they are unknowingly herding into a rather narrow band of commonly held stocks that appear inflated in price. Most importantly, and above all else, when the market eventually corrects, we also believe that these same stocks most commonly held among ETFs will represent a fertile hunting ground for the most attractive bargains. These factors seem likely to become exaggerated in ETF strategies that necessitate holdings where liquidity in the underlying is insufficient, and pro-rata selling across a basket of securities could create very attractive opportunities on a bottom-up basis. In these special cases it seems possible for bargain hunters to purchase the ETFs themselves at a discount to NAV.
Not surprisingly, for the independent-minded bargain hunter the current opportunity set lies well outside of the ETF thoroughfares. Likewise, when the market eventually declines we believe investors inhabiting names primarily outside of the major ETF holdings possess a better chance to preserve investor capital. In sum, it has most often been the case that market downturns create the proving grounds for value managers as they are tasked with offering the dual service of capital preservation and opportunistic bargain hunting to create future returns. We believe that the only way this is possible to invest differently from the crowd, and this time will be no different.
This information is for one-on-one client presentation only. Past performance is not indicative of future results. The actual characteristics with respect to any particular client account will vary based on a number of factors including but not limited to: (i) the size of the account; (ii) investment restrictions applicable to the account, if any; and (iii) market exigencies at the time of investment. Templeton & Phillips Capital Management, LLC (“TPCM”) reserves the right to modify its current investment strategies and techniques based on changing market dynamics or client needs. The information provided in this report should not be considered a recommendation to purchase or sell any particular security. There is no assurance that any securities discussed herein will remain in an account’s portfolio at the time you receive this report or that securities sold have not been repurchased. The securities discussed may not represent an account’s entire portfolio and in the aggregate may represent only a small percentage of an account’s portfolio holdings. It should not be assumed that any of the securities transactions, holdings or sectors discussed were or will prove to be profitable, or that the investment recommendations or decisions we make in the future will be profitable or will equal the investment performance of the securities discussed herein. Recommendations from the past 12 months are available upon request. Information was obtained from third party sources which we believe to be reliable but are not guaranteed as to their accuracy or completeness. The comparative benchmark represents past performance and is utilized on the statement solely for comparative purposes and may not be indicative of future results. The MSCI AC (All Country Total Return Index) Index is a free float-adjusted market capitalization weighted index that is designed to measure the equity market performance of developed and emerging markets. The volatility of this index could be materially different from that of the portfolio. The index does not reflect fees and expenses and is not available for direct investment. 1Returns are presented net of investment advisory fees and include the reinvestment of all income. TPCM is a registered investment adviser. Registration does not imply a certain level of skill or training. More information about TPCM including its advisory services and fee schedule can be found in Form ADV Part 2 which is available upon request. LTF-17-11
About The Author: Scott Phillips
Scott Phillips is a principal and portfolio manager at Templeton and Phillips Capital Management, LLC. Prior to working with Templeton and Phillips Capital Management, LLC, Scott Phillips founded Cumberland Capital Corp, located in Chattanooga, TN. Founded in June 2004, Cumberland Capital provided equity research services to Green Cay Asset Management, a hedge fund management company located in Nassau, Bahamas. In this capacity with Cumberland Capital, Scott was the lead research analyst on the Siebels Hard Asset Fund a long/short equity fund managed by Green Cay Asset Management. In addition to consulting on this fund Scott also provided equity recommendations for the Green Cay Emerging Markets Fund. Prior to consulting Green Cay’s funds Scott was employed as a research analyst with Green Cay beginning in January of 2004. Before joining Green Cay, Scott was an equity research associate analyst with SunTrust Robinson Humphrey (including its predecessor companies) in Atlanta GA from January of 1999 to December of 2003. Scott co-authored with Lauren Templeton of the book “Investing the Templeton Way” released in 2008 by McGraw Hill. Scott is also the author of “Buying at the Point of Maximum Pessimism” a book on forward looking investment themes published by the FT Press in 2010. In addition to these books, Scott co-authored a revision of William Proctor’s 1983 biography of Sir John Templeton titled “The Templeton Touch” released in December 2012. Scott is a member of the John Templeton Foundation where he serves on the Finance Committee and Scott serves as chairman for the board trustees of the Templeton Foundation Inc, and as a member of the Audit Committee. Scott received his B.A. The University of the South.
More posts by Scott Phillips