This article is authored by MOI Global instructor Phil Ordway, Managing Principal at Anabatic Investment Partners, based in Chicago, Illinois.
If good investment ideas are said to be found in the gap between perception and reality, the airline industry has several candidates for the hall of fame. I don’t think I’ve ever found lower – or crazier – expectations than in the airline industry.
Recent headlines have been loud and definitive, as usual, even though the business reality is more nuanced. 2018 featured moderate capacity growth, much higher expenses for fuel and labor, and strong demand. The price of oil increased for much of the year, hurting margins and year-over-year comparisons. Then, just as oil spiked in early October and many market commentators assured us that the price of oil was going to cross $100 per barrel, the price collapsed and finished the year down 25%.
One thing I know is that oil prices will fluctuate and many – maybe even most – forecasts will prove useless. The airlines obviously can’t control the price of oil, but they have proven the ability to post good profits with oil above $100 per barrel and below $30 – a point that is lost on everyone in 2018 who seemed to worry about rising oil and falling oil. On my “worry list” for our airline investments oil doesn’t even make the top 10.
A more important – but likewise unknowable – macro factor is demand. Airlines are cyclical, albeit with differing business models that in some cases are quite adaptable and resilient. Decades of vicious competition and numerous restructurings and mergers have left an industry that is more than capable of thriving through the cycle. Again, I’m not here to argue that these are enterprise software companies about to conquer the world. Airlines must deal with a competitive, cyclical, capital- and labor-intensive industry, and that is not going to change. Likewise, the core attributes of the business are also unlikely to change, and I believe the current stream of earnings and cash flow is attractive and sustainable.
Alaska (ALK) equity returned (15.6%) in 2018 but the business made impressive progress. The Virgin America integration is almost done – with good results – and the company can re-focus on optimizing its assets. For several decades Alaska has run a smart, reliable, and profitable operation, but the market seems to imply that the company has forgotten everything it once knew.
The balance sheet is in good shape, with approximately half of the debt used to acquire Virgin American 25 months ago having already been paid down. Further deleveraging is likely in 2019, and the company has plenty of capacity to absorb shocks from the economy or its competitors. The core airline operation continues to offer good value and excellent service to its customers.[13]
The loyalty program remains a valuable and underappreciated asset. It is growing at a double-digit rate (in terms of members, cardholders, and cardholder spending) and producing precious, high-margin cash flow that requires almost no incremental capital. The loyalty program’s cash flow also enables the company to finance the fleet much more efficiently. In the old days Alaska (and other airlines) would have to use expensive debt or equity to buy new aircraft. Today, Alaska gets approximately $1 billion of financing or “float” from its loyalty program. Every month Alaska receives a payment from Bank of America based on the use of its card, but Alaska’s liability on that cash inflow is in miles or travel awards that customers do not redeem for 18-24 months, on average. Beyond the free use of money for a year or two, there is a “breakage” rate of more than 17% as miles/awards expire or are never redeemed. The result is a little bit like getting paid to borrow money.
Consider the effect on the company’s balance sheet over time. In the chart below the company’s plant, property and equipment (shown by the green bars) grew from about $3 billion just over a decade ago to about $6.5 billion today. That significant investment was increasingly financed by the loyalty program’s cash flow. It is also notable that coming out of the global financial crisis in 2010, the company began to generate so much cash flow that it built up more cash than debt by 2012. By 2015 and 2016 working capital had turned negative as the cash flow from the loyalty program accelerated under more generous terms from Bank of America. These factors combined to enable Alaska to issue debt to pay for the all-cash Virgin America acquisition and finance its fleet at very attractive rates.
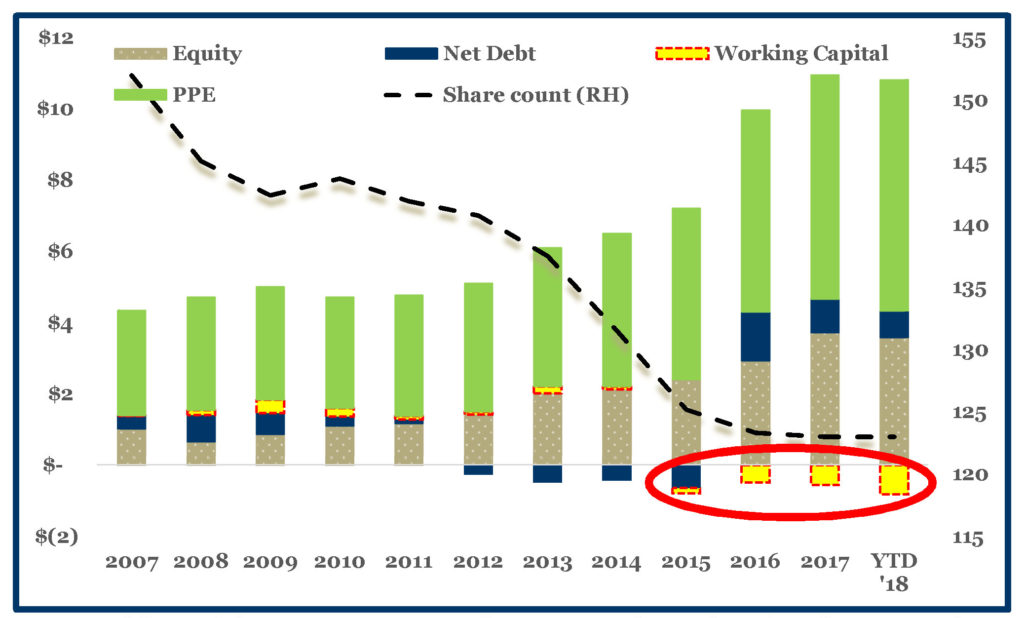 USD (LH) in billions and shares outstanding (RH) in millions. Source: Anabatic analysis of SEC filings. YTD as of Sept. 2018.
For this and many reasons Alaska’s future is promising. It maintains an appealing value proposition to its customers, a durable culture and engaged employees, a healthy balance sheet, and plenty of cash flow. Barring unforeseen changes this is an investment I hope to hold for many years.
Spirit (SAVE) was the big winner in 2018 as the shares returned 29.1%. Better yet was the progress the company made by optimizing its route network, achieving approximately 50% of revenue from non-ticket sales, and recording the best on-time performance in America in October 2018.
I have a deep appreciation for the power of a low-cost business model, and Spirit offers yet another example. Despite a big increase in pilot costs that took effect in 2018, Spirit’s unit costs declined year-over-year and its advantage relative to the industry is likely to widen over time. The “basic economy” fares introduced by other non-ULCC airlines has also partitioned the direct, price-only competition into a discrete segment, enabling rational long-term competition by all airlines.
Spirit’s balance sheet is in good shape with almost $1 billion of cash on hand. An economic downturn could well benefit Spirit if customers “trade down” to a cheaper airfare as they have in prior economic slowdowns. Nonetheless, a few major questions and potential snags remain.
- 2018 came and went without a promised decision on the fleet. Within a few years Spirit will be at the end of its current order book and the company needs to decide how it wants to proceed. It might place a large A220 order, introducing a second aircraft type to the fleet. The A220 has impressive capabilities and unit economics it would also add considerable complexity and overhead. Adding the A220 would also reduce the attractiveness of a Spirit-Frontier merger, a deal that is not imminent but one that could be appealing at some point.
- Spirit CEO Bob Fornaro announced his retirement in 2018, and on January 1, 2019 Ted Christie was promoted from President and CFO to CEO. Significant changes in strategy or operating performance are unlikely, but all management successions come with their own challenges (and opportunities).
- Spirit is at a disadvantage to some of its non-ULCC competitors because it lacks the massive cash flow, margin, and financing benefits of a powerhouse loyalty program. The ULCC business model is by no means dependent on a loyalty program, but it’s a key asset for other airlines (as noted above).
Delta (DAL) is our “newest” airline investment. The stock price fell 8.7% in 2018 (including dividends) and it fell even more in early January 2019.
The company’s competitive position strengthened in 2018, continuing an impressive run that began more a decade ago. Delta was featured as an example in our July 2018 letter and I won’t repeat that discussion, but suffice it to say that Delta is a paragon of operational excellence and prudent management. I can think of very few businesses or management teams with such sterling credentials accompanied by such low expectations.
The capital allocation has also been good, if not quite perfect. Management has maintained a strong, investment-grade balance sheet and shored up the pension. The fleet has been expertly managed, with significant investment along the way. The share count has declined by 20% over five years due to repurchases made at attractive prices. New lines of business have been established in MRO and logistics, among others, driving several billion dollars of revenues at accretive margins. Delta now owns significant equity stakes in Air France-KLM, Aeromexico, Virgin Atlantic, China Eastern, and Gol to go with several international JVs. Its partnership with American Express, among the world’s very best co-branded marketing alliances, produces more than $3 billion of operating cash flow for Delta (along with exceptional margins, free cash flow, and float).
The ultimate test of our airline investments – and all our investments – will be the cash flows these companies produce over time. I remain very encouraged by our prospects and I would be glad to own these investments even if – especially if – the market prices declined further.
[1]Alaska won the annual JD Power award for highest customer satisfaction for the 11th straight year. It also won “Best U.S. Airline” from Condé Nast Traveler’s Readers’ Choice Awards; “No. 1 U.S. Airline for 2018” from AQR; and “Best travel rewards program” from U.S. News, among many others.
Disclaimer: Gross Long and Gross Short performance attribution for the month and year-to-date periods is based on internal calculations of gross trading profits and losses (net of trading costs), excluding management fees/incentive allocation, borrowing costs or other fund expenses. Net Return for the month is based on the determination of the fund’s third-party administrator of month-end net asset value for the referenced time period, and is net of all such management fees/incentive allocation, borrowing costs and other fund expenses. Net Return presented above for periods longer than one month represents the geometric average of the monthly net returns during the applicable period, including the Net Return for the month referenced herein. An investor’s individual Net Return for the referenced time period(s) may differ based upon, among other things, date of investment. In the event of any discrepancy between the Net Return contained herein and the information on an investor’s monthly account statement, the information contained in such monthly account statement shall govern. All such calculations are unaudited and subject to further review and change. For purposes of the foregoing, the calculation of Exposure Value includes: (i) for equities, market value, and (ii) for equity options, delta-adjusted notional value.
THE INFORMATION PROVIDED HEREIN IS CONFIDENTIAL AND PROPRIETARY AND IS, AND WILL REMAIN AT ALL TIMES, THE PROPERTY OF ANABATIC INVESTMENT PARTNERS LLC, AS INVESTMENT MANAGER, AND/OR ITS AFFILIATES. THE INFORMATION IS BEING PROVIDED SOLELY TO THE RECIPIENT IN ITS CAPACITY AS AN INVESTOR IN THE FUNDS OR PRODUCTS REFERENCED HEREIN AND FOR INFORMATIONAL PURPOSES ONLY.
THE INFORMATION HEREIN IS NOT INTENDED TO BE A COMPLETE PERFORMANCE PRESENTATION OR ANALYSIS AND IS SUBJECT TO CHANGE. NONE OF ANABATIC INVESTMENT PARTNERS LLC, AS INVESTMENT MANAGER, THE FUNDS OR PRODUCTS REFERRED TO HEREIN OR ANY AFFILIATE, MANAGER, MEMBER, OFFICER, EMPLOYEE OR AGENT OR REPRESENTATIVE THEREOF MAKES ANY REPRESENTATION OR WARRANTY WITH RESPECT TO THE INFORMATION PROVIDED HEREIN. AN INVESTMENT IN ANY FUND OR PRODUCT REFERRED TO HEREIN IS SPECULATIVE AND INVOLVES A HIGH DEGREE OF RISK. THERE CAN BE NO ASSURANCE THAT THE INVESTMENT OBJECTIVE OF ANY SUCH FUND OR PRODUCT WILL BE ACHIEVED. MOREOVER, PAST PERFORMANCE SHOULD NOT BE CONSTRUED AS A GUARANTEE OR AN INDICATOR OF THE FUTURE PERFORMANCE OF ANY FUND OR PRODUCT. AN INVESTMENT IN ANY FUND OR PRODUCT REFERRED TO HEREIN CAN LOSE VALUE. INVESTORS SHOULD CONSULT THEIR OWN PROFESSIONAL ADVISORS AS TO LEGAL, TAX AND OTHER MATTERS RELATING TO AN INVESTMENT IN ANY FUND OR PRODUCT.
THIS IS NOT AN OFFER TO SELL OR SOLICITATION OF AN OFFER TO BUY AN INTEREST IN A FUND OR PRODUCT. ANY SUCH OFFER OR SOLICITATION WILL BE MADE ONLY BY MEANS OF DELIVERY OF A FINAL OFFERING MEMORANDUM, PROSPECTUS OR CIRCULAR RELATING TO SUCH FUND AND ONLY TO QUALIFIED INVESTORS IN THOSE JURISDICTIONS WHERE PERMITTED BY LAW.
ALL FUND OR PRODUCT PERFORMANCE, ATTRIBUTION AND EXPOSURE DATA, STATISTICS, METRICS OR RELATED INFORMATION REFERENCED HEREIN IS ESTIMATED AND APPROXIMATED. SUCH INFORMATION IS LIMITED AND UNAUDITED AND, ACCORDINGLY, DOES NOT PURPORT, NOR IS IT INTENDED, TO BE INDICATIVE OR A PREDICTOR OF ANY SUCH MEASURES IN ANY FUTURE PERIOD AND/OR UNDER DIFFERENT MARKET CONDITIONS. AS A RESULT, THE COMPOSITION, SIZE OF, AND RISKS INHERENT IN AN INVESTMENT IN A FUND OR PRODUCT REFERRED TO HEREIN MAY DIFFER SUBSTANTIALLY FROM THE INFORMATION SET FORTH, OR IMPLIED, HEREIN.
PERFORMANCE DATA IS PRESENTED NET OF APPLICABLE MANAGEMENT FEES AND INCENTIVE FEES/ALLOCATION AND EXPENSES, EXCEPT FOR ATTRIBUTION DATA, TO THE EXTENT REFERENCED HEREIN, OR AS MAY BE OTHERWISE NOTED HEREIN. NET RETURNS, WHERE PRESENTED HEREIN, ASSUME AN INVESTMENT IN THE APPLICABLE FUND OR PRODUCT FOR THE ENTIRE PERIOD REFERENCED. AN INVESTOR’S INDIVIDUAL PERFORMANCE WILL DIFFER BASED UPON, AMONG OTHER THINGS, THE FUND OR PRODUCT IN WHICH SUCH INVESTMENT IS MADE, THE INVESTOR’S “NEW ISSUE” ELIGIBILITY (IF APPLICABLE), AND DATE OF INVESTMENT. IN THE EVENT OF ANY DISCREPANCY BETWEEN THE INFORMATION CONTAINED HEREIN AND THE INFORMATION IN AN INVESTOR’S MONTHLY ACCOUNT STATEMENT IN RESPECT OF THE INVESTOR’S INVESTMENT IN A FUND OR PRODUCT REFERRED TO HEREIN, THE INFORMATION CONTAINED IN THE INVESTOR’S MONTHLY ACCOUNT STATEMENT SHALL GOVERN.
NOTE ON INDEX PERFORMANCE
INDEX PERFORMANCE DATA AND RELATED METRICS, TO THE EXTENT REFERENCED HEREIN, ARE PROVIDED FOR COMPARISON PURPOSES ONLY AND ARE BASED ON (OR DERIVED FROM) DATA PUBLISHED OR PROVIDED BY EXTERNAL SOURCES. THE INDICES, THEIR COMPOSITION AND RELATED DATA GENERALLY ARE OWNED BY AND ARE PROPRIETARY TO THE COMPILER OR PUBLISHER THEREOF. THE SOURCE OF AND AVAILABLE ADDITIONAL INFORMATION REGARDING ANY SUCH INDEX DATA IS AVAILABLE UPON REQUEST.
About The Author: Philip Ordway
Philip Ordway is Principal and Portfolio Manager of Anabatic Fund, L.P. Previously, Philip was a partner at Chicago Fundamental Investment Partners (CFIP). At CFIP, which he joined in 2007, Philip was responsible for investments across the capital structure in various industries. Prior to joining Chicago Fundamental Investment Partners, Philip was an analyst in structured corporate finance with Citigroup Global Markets, Inc. from 2002 to 2005, where he was part of a team responsible for identifying financing solutions for companies initially in the global power and utilities group and ultimately in the global autos and industrials group. Philip earned his M.B.A. from the Kellogg School of Management at Northwestern University in 2007 and his B.S. in Education & Social Policy and Economics from Northwestern University in 2002.
More posts by Philip Ordway