This article is authored by MOI Global instructor Brian Chingono, partner and director of quantitative research at Verdad Advisers, based in New York.
Brian is an instructor at European Investing Summit 2023.
Financial theory suggests there are two ways to outperform the market: either by purchasing a stream of income at a substantial discount or by paying the market price for a stream of income that grows faster than expected.
These two approaches underpin the standard “value” and “growth” styles of investing. We’ve written extensively about the main challenges to the growth approach: the lack of persistence in earnings growth and the difficulty of forecasting this growth over time. The main challenge to pursuing a value investing strategy is that cheap assets can remain cheap for extended periods of time, leaving investors to wonder if they’ve bought a value trap or a melting ice cube.
We believe the best safeguard for value investing is to prefer cheap stocks that have a higher return on assets. While growth in earnings generally lacks persistence beyond random chance, measures of asset productivity have been shown to persist over time. In the same way, while a software engineer at a startup may not be able to predict the growth rate of his future earnings, it’s likely that his productivity in churning out code will be similar from one job to the next. In the profitability research pioneered by Robert Novy-Marx, firms with more productive assets outperformed over time, especially if those firms were purchased at low valuations. Owning these more productive assets can be anxiety reducing: their income streams tend to be more steady, and fears of a fundamentally broken business model can be assuaged by the obvious qualities of the business.
Larry Summers once quipped that Japan was a nursing home, Europe was a museum, and China was a jail. And, while we tend to agree with his dismissive attitude toward China, we’ve found reasons to think more highly of Europe and Japan. Notably, we find that value stocks in Europe and Japan are more profitable, with Europe being particularly impressive. Among firms that trade at a discount to book value, Europe has a Gross Profit/Assets ratio of 18.5%, which is 1.5x the profitability of North American value firms. The differences are even more stark in terms of EBITDA/Assets, with Europe’s value firms delivering a 6.4% return on assets, almost 3x higher than North America’s profitability among value firms.
The chart below compares the average level of profitability (i.e., return on assets) among firms that trade below book value. By focusing on firms whose stock price trades at a discount to book value, we can hold the valuation component fixed in order to isolate the variation in profitability among value firms in different geographies.
The figure below shows the results of this analysis across major developed markets. The bar graphs measure the median amount of profitability among companies that trade at a discount to book value. The circles above each bar reflect the median profitability of all stocks in each market. As a robustness check, profitability is measured two different ways, first in terms of gross profit per dollar of assets and second as EBITDA per dollar of assets.
Figure 1: Profitability Across Geographies and Among Value Firms (August 2023)
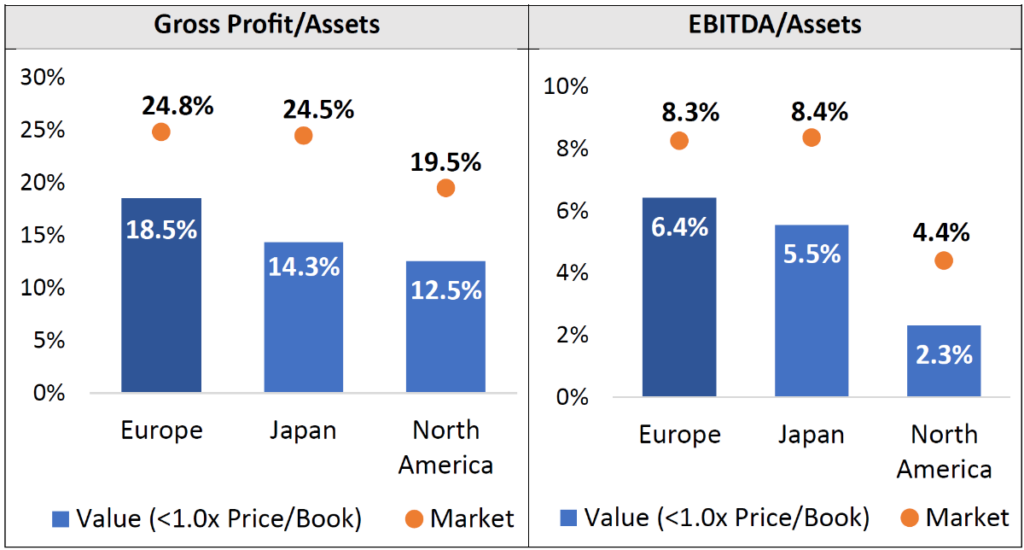
Source: S&P Capital IQ and Verdad analysis
Value stocks everywhere are less profitable than the broader market. But we see that European and Japanese value stocks are significantly more profitable than North American value stocks. Indeed, because the North American market has a long tail of unprofitable biotech and venture-backed firms, the median return on assets is higher in international markets at 8% EBITDA/Assets in Europe and Japan versus 4% in North America.
After decades of stock market outperformance in the US relative to international markets, capital has flooded into the US market while largely shunning international markets. Today, the North American market trades at 3.9x Price/Book versus market averages of 1.9x in Europe and 1.4x in Japan, according to data from MSCI. In our view, this makes international markets much more attractive because decent returns on assets can be found at reasonable prices.
We believe Europe is particularly attractive by this measure because the valuation multiples of cheap stocks in Europe have barely changed since the dark days of COVID. Even as fundamentals have improved for Europe’s value stocks over the past three years, multiples have remained depressed because of the economic uncertainty created by the war in Ukraine since early 2022. As a result, there are disproportionately more stocks with attractive profitability metrics in Europe that trade at a discount to book value.
The stagnation of valuation multiples among Europe’s cheapest stocks over the past three years means that valuation spreads within Europe remain at historically wide levels, as shown in the figure below. Measured as the spread between the cheapest 30% of stocks and the most expensive 30% by Price/Book, the valuation spread in Europe reached its most extreme level in 2021 when value stocks traded at 0.8x Price/Book. Today, Europe’s value segment still trades at 0.8x Price/Book, according to data from S&P Capital IQ. So even as fundamentals for Europe’s value stocks have improved over the past three years, they remain extremely cheap relative to growth stocks, with spreads more than two standard deviations away from their 48-year historical average.
Figure 2: European Valuation Spreads (1975–2023)
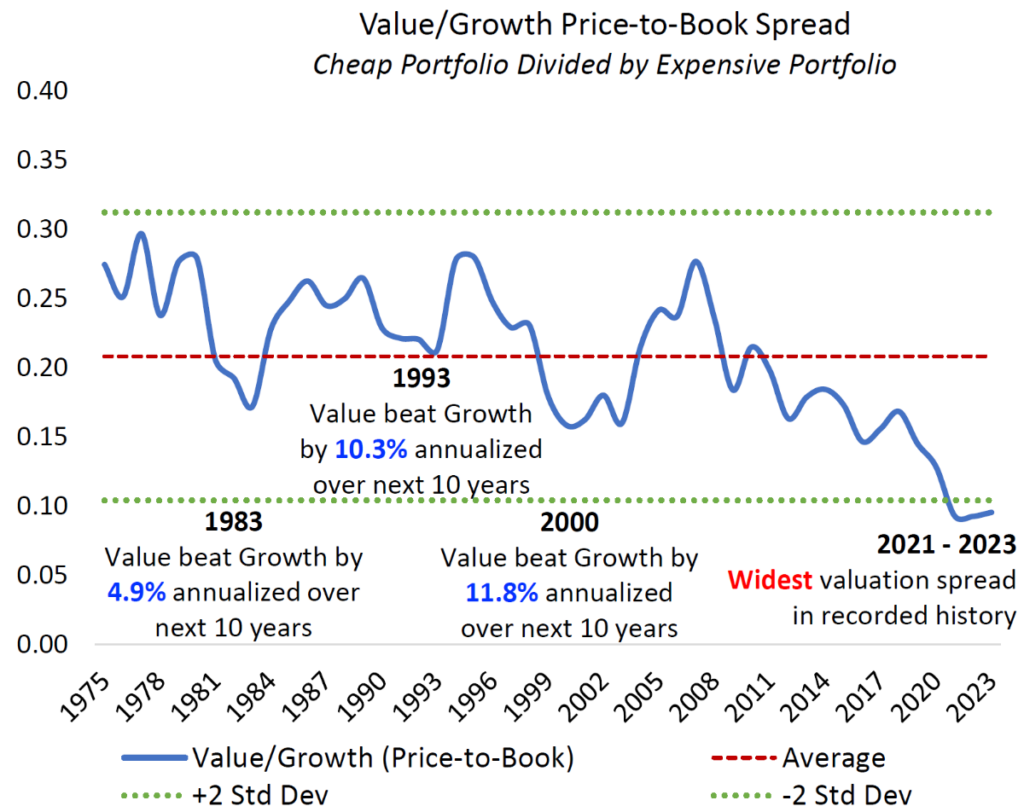
Source: Ken French data library and S&P Capital IQ
We believe that the combination of historically wide valuation spreads in Europe and higher levels of profitability among Europe’s value stocks bolster the case for upward mean reversion going forward. Historically, mean reversion in multiples has supported significant outperformance of value relative to growth, as shown in the above chart. And even if the mean reversion process takes time to play out, investors in European value stocks can earn a higher return on assets while they wait for multiple expansion.
Today, Europe’s value stocks deliver a 6.4% return on assets, measured as EBITDA/Assets. After any capital expenditures, the residual cash component of these earnings can be distributed to investors through dividends, share buybacks, and deleveraging.
Cash distributions appear to be significantly higher in Europe, with the MSCI Europe Value Index offering a dividend yield of 4.7% versus 3% in other developed markets tracked by MSCI. In today’s world of higher cost of capital—where investors finally get paid to wait—we believe Europe’s cheap and profitable stocks offer an attractive place to earn more bang for your buck.
Disclaimers: This does not constitute an offer, solicitation or recommendation to sell or an offer to buy any securities, investment products or investment advisory services. This information generated by the charts, tables, and graphs presented herein is for general informational and general comparative purposes only. This document may contain forward-looking statements that are based on our current beliefs and assumptions and on information currently available that we believe to be reasonable, however, such statements necessarily involve risks, uncertainties and assumptions, and investors may not put undue reliance on any of these statements. References to indices or benchmarks herein are for informational and general comparative purposes only. Indexes are unmanaged and have no fees or expenses. An investment cannot be made directly in an index. The information in this presentation is not intended to provide, and should not be relied upon for, accounting, legal, or tax advice or investment recommendations. Each recipient should consult its own tax, legal, accounting, financial, or other advisors about the issues discussed herein.
Members, log in below to access the restricted content.
Not a member?
Thank you for your interest. Please note that MOI Global is closed to new members at this time. If you would like to join the waiting list, complete the following form:
About The Author: Brian Chingono
Brian Chingono worked at Dimensional Fund Advisors and Credit Suisse before joining Verdad. Brian earned an AB from Harvard College and an MBA with honors from the University of Chicago Booth School of Business. As a graduate student, Brian co-authored two research papers related to Verdad’s investment strategy: Leveraged Small Value Equities and Forecasting Debt Paydown Among Leveraged Equities.
More posts by Brian Chingono