
This article is authored by MOI Global instructor Brian Chingono, partner and director of quantitative research at Verdad Advisers, based in New York.
Brian is an instructor at European Investing Summit 2024.
After a stellar 15-year run of robust earnings growth, US stocks have appreciated so much that they now represent 70% of developed market allocations, according to popular indices like the MSCI All Country World Index (ACWI).
As American earnings growth has outpaced international peers over the past 15 years, US stocks have returned 13.4% annualized, more than doubling the 5.9% annualized return of developed international stocks.
But with more than a quarter of total US market capitalization being attributable to just six technology stocks today, it’s worth questioning whether hyper-concentration in yesterday’s winners will be a winning strategy in the years ahead.
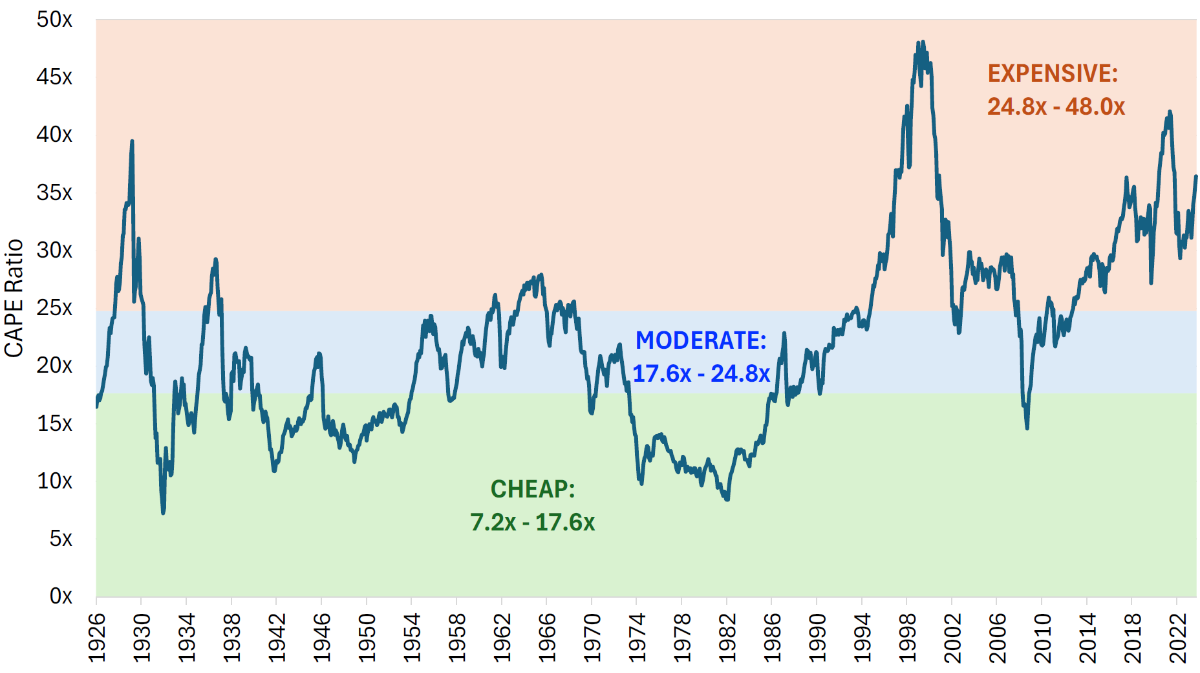
To start, it’s worth noting that the US stock market’s magnificent run over the past 15 years has resulted in a cyclically adjusted PE ratio (CAPE) of 36x today, a valuation level that is firmly within expensive territory by historical standards. In the figure below, we grouped historical values of the United States’ CAPE ratio into three categories with an equal number of monthly observations. Each category is highlighted as a backdrop to the time series of US market valuations since 1926.
While the US market trades at an expensive valuation of 36x CAPE today, international markets are more moderately priced, with the European market trading at 21x CAPE and the Japanese market valued at 25x CAPE as of June 30, 2024. As a forward-looking measure, the CAPE ratio has a negative relationship with expected returns, as shown in the figure below, with higher CAPE valuations being associated with lower returns over the next decade.
Figure 2: Global 10-Year Returns vs CAPE Ratio (US: 1926–2024), (Int’l: 1975–2024)
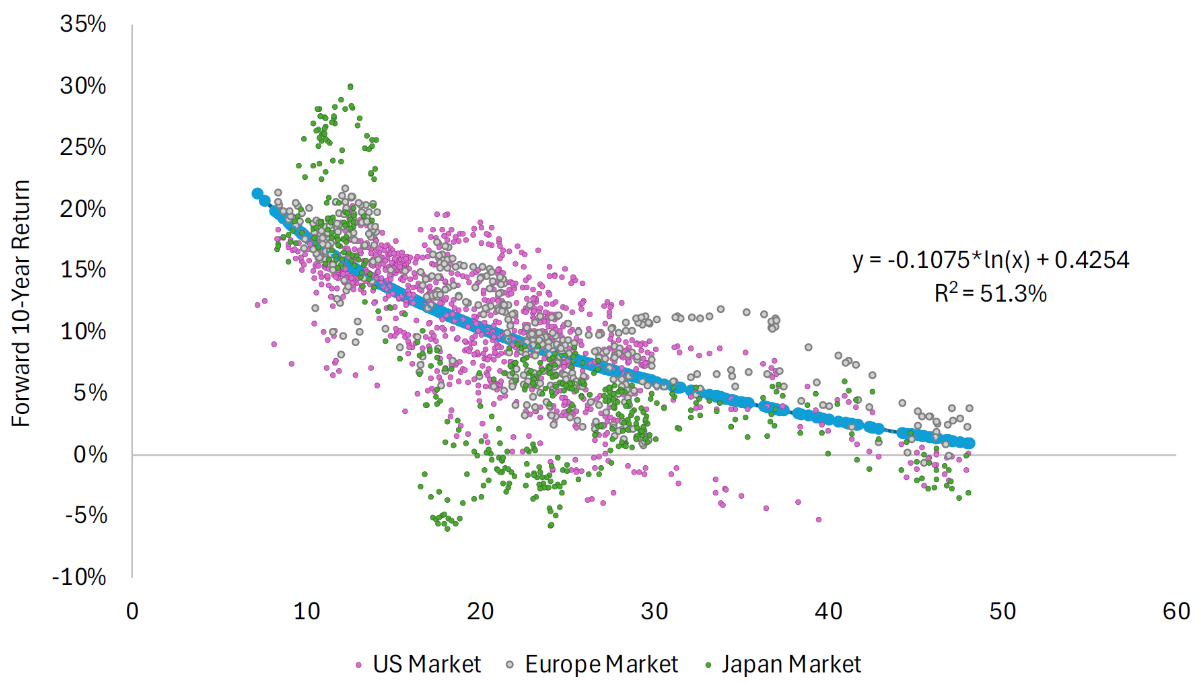
Source: Robert Shiller’s website and Ken French’s website. The regression function applies to the US market.
In addition to lowering expected returns, the expensive valuations in the US may also increase idiosyncratic risk in a portfolio through hyper-concentration in the biggest winners of the past decade. Consider a seemingly diversified index like the ACWI benchmark, which contains more than 2,750 large- and mid-cap stocks from around the world. This global index mechanically allocates two-thirds of capital to the United States, and within its developed market allocation, the United States has a weighting of almost 70%.
Figure 3: MSCI ACWI Allocations (June 30, 2024)
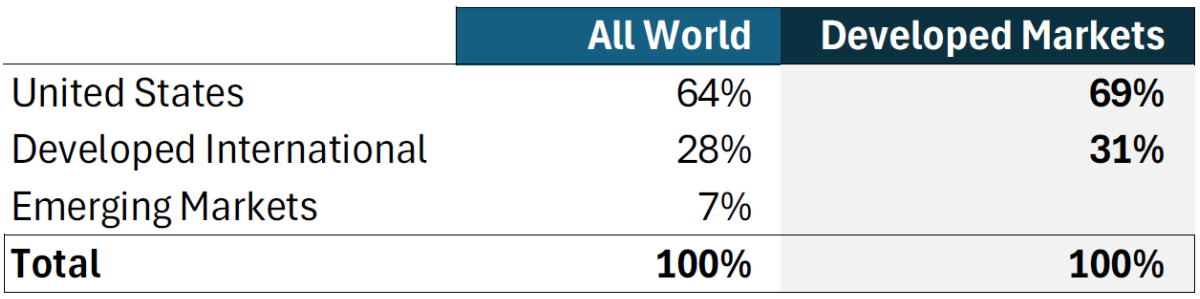
Source: MSCI.
To understand why a 70% US allocation may not be the optimal choice for a typical investor in developed markets, it’s important to trace how the ACWI Index arrived at this allocation in the first place. At a fundamental level, equity ownership entitles investors to a portion of companies’ future net income. If we start at this elementary level and sort all developed-market stocks by the net income they generated over the past 12 months, we find that 55% of net income was generated by US firms and 45% was generated by firms in developed international markets. So if an investor were to allocate capital according to where income is being generated today, they would have 55% of their developed equity capital in the US and 45% allocated to international markets.
But financial markets are forward looking. So, in addition to considering trailing earnings, market participants also account for growth expectations when setting prices. Because growth expectations are higher in the US relative to international regions, aggregate market capitalization is significantly larger in the United States. Therefore, based on relative growth expectations, the US allocation within a developed market portfolio increases by 10 percentage points to 65% when companies are sorted by market capitalization.
An implicit assumption behind this market-weighted approach is that analysts are accurate in forecasting earnings growth. But empirical evidence suggests that, on average, analyst forecasts are no better than nominal GDP estimates when forecasting earnings growth over long-term horizons.
Figure 4: Developed Market Allocations by Weighting Methodology (July 2024)
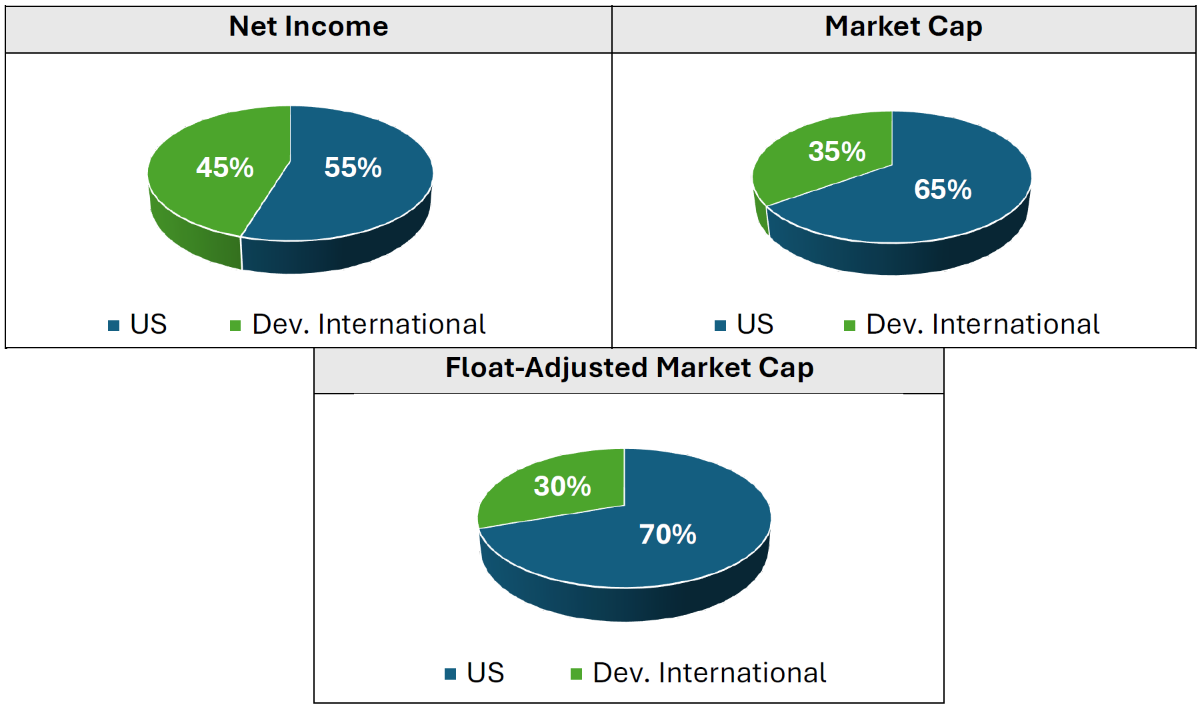
Source: S&P Capital IQ.
Beyond the doubtful accuracy of long-term growth forecasts, commercial indices further orient investors toward questionable allocations by focusing on float-adjusted market capitalization. This means more weight is given to stocks that have a higher proportion of shares available to trade freely on the stock exchange, as opposed to the strategic ownership stakes held by founders and other company insiders. The reason commercial indices prioritize free float is because they are designed for deploying capital at massive scale, especially for the likes of Vanguard and BlackRock. And it also happens to be the case that US firms tend to have a higher proportion of free float relative to their international peers in Europe and Japan. Therefore, the free-float adjustment further exacerbates the bias toward high-expectation US stocks, raising the US allocation by 5 percentage points to a 70% weight when developed market stocks are sorted by float-adjusted market cap.
Fortunately, there are other benchmarks available to investors who are skeptical of lofty growth expectations and aren’t massive enough to be comparable to State Street. For example, investors could start by setting their regional weights according to net income generation (i.e., 55% weight in the US and 45% in developed international markets). Notably, this starting point offers more balanced allocations while still acknowledging the principal role of the United States as an economic engine.
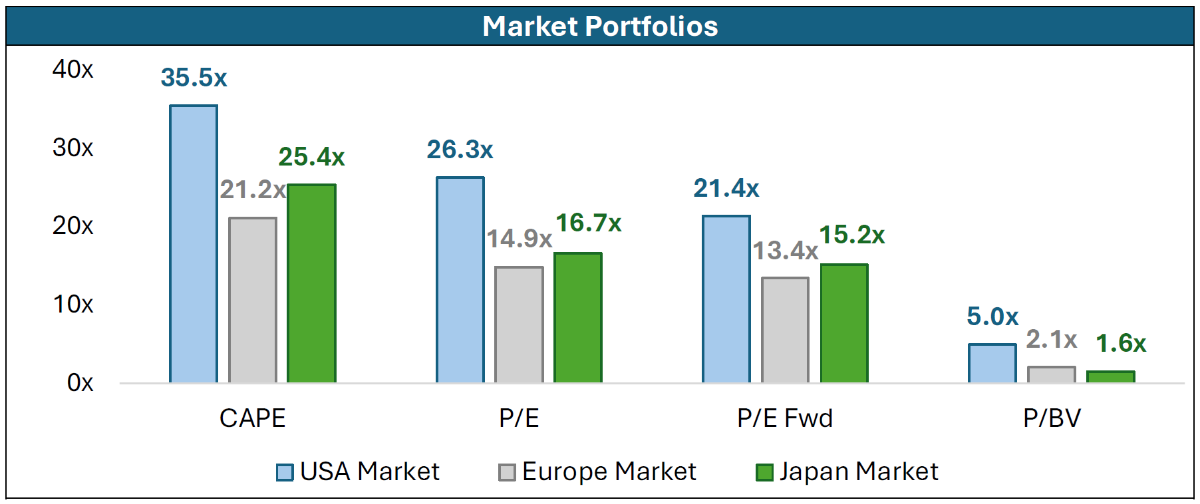
By setting regional weights according to net income, rather than float-adjusted market cap, investors would also benefit from capturing more attractive valuations in international regions. As shown in the chart below, international markets trade at a substantial discount to the US, across multiple measures of value. And within the cheapest segment of each market, valuations are especially attractive internationally, with P/E ratios averaging around 10–13x and Price/Book ratios averaging around 1.1–1.4x across all levels of capitalization.
Figure 5: Global Valuations (July 2024)
Source: S&P Capital IQ.
We believe more balanced allocations across regions would enable investors to increase expected returns within their equity portfolios. Based on current levels of the CAPE ratio, the Nobel laureate economist Robert Shiller estimates that nominal expected returns over the next decade are around 5.2% in the US market, compared to 6.7% in the European market and 6.8% in the Japanese market.
While the US market has dominated over the past decade, an encore may not necessarily follow over the next decade. Growth narratives that previously seemed inevitable can quickly change when faced with reality. For example, consider how the “magnificent seven” has recently shrunk to the “magnificent six,” with Tesla down 14% year-to-date as expectations for electric vehicle growth have moderated. Only 12 months ago, auto industry forecasts by S&P Global were projecting 38% annual growth in EV production in 2024. But in July of 2024, that same forecast was slashed by more than half to 14% growth. Perhaps more concerning for those who bet on EV growth, there are indications that hybrids may play a larger role in the energy transition than previously anticipated, with many car manufacturers announcing new hybrid models and some moving toward flexible architectures that would continue their production of internal combustion vehicles indefinitely, alongside hybrids and EVs. Cars that are at least partially powered by fossil fuels may not become obsolete at all.
If this downward revision in growth expectations could occur among EVs, which are subsidized (and in some cases mandated), we believe a similar reality check could occur with current expectations for artificial intelligence. Relative to the US, international markets are less exposed to the AI expectation frenzy. So when considering a benchmark for their global developed equity portfolio, investors may be well served by balanced allocations that are based on net income generation, with around 55% weight in the US and 45% internationally.
Disclaimers: This does not constitute an offer, solicitation or recommendation to sell or an offer to buy any securities, investment products or investment advisory services. This information generated by the charts, tables, and graphs presented herein is for general informational and general comparative purposes only. This document may contain forward-looking statements that are based on our current beliefs and assumptions and on information currently available that we believe to be reasonable, however, such statements necessarily involve risks, uncertainties and assumptions, and investors may not put undue reliance on any of these statements. References to indices or benchmarks herein are for informational and general comparative purposes only. Indexes are unmanaged and have no fees or expenses. An investment cannot be made directly in an index. The information in this presentation is not intended to provide, and should not be relied upon for, accounting, legal, or tax advice or investment recommendations. Each recipient should consult its own tax, legal, accounting, financial, or other advisors about the issues discussed herein.
Members, log in below to access the restricted content.
Not a member?
Thank you for your interest. Please note that MOI Global is closed to new members at this time. If you would like to join the waiting list, complete the following form:
About The Author: Brian Chingono
Brian Chingono worked at Dimensional Fund Advisors and Credit Suisse before joining Verdad. Brian earned an AB from Harvard College and an MBA with honors from the University of Chicago Booth School of Business. As a graduate student, Brian co-authored two research papers related to Verdad’s investment strategy: Leveraged Small Value Equities and Forecasting Debt Paydown Among Leveraged Equities.
More posts by Brian Chingono