This article is authored by MOI Global instructor Danilo Santiago, founder of Rational Investment Methodology (RIM), based in New York. Danilo is an instructor at Best Ideas 2018, the fully online conference featuring more than one hundred expert instructors from the MOI Global membership community.
During times when blocks of digital text are negotiated for thousand of US dollars, I thought it would be useful to remind you of some ancient dynamics that are still prevalent on the stock market today.
The “reversion to the mean” in terms of share prices is alive and well, even on the presence of a TINA (There Is No Alternative) market that has suffered from an increased influence from “indexing strategies” (e.g. ETFs) and algorithms (e.g. robot-traders). In other words, EPS is still on the driver’s seat in the short-term; a quest for true value commands the long-term.
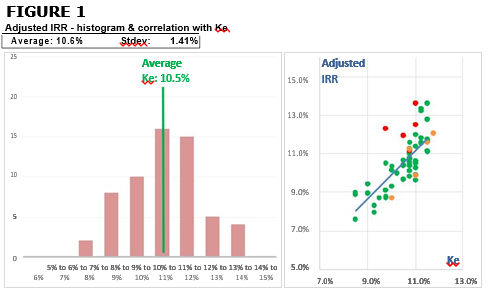
Let’s start with the evidence for the reversion to the mean: figure 1 shows the average IRR [Internal Rate of Return] over the past 20 years for the companies I follow (60 in total; I call them my Circle of Competence) vs a Ke [Cost of Equity], calculated using a normalized Rf [Risk free interest rate] of 5% and a MRP [Market Risk Premium] of also 5%. It is clear that there is a strong correlation between the delivered IRR’s and estimated Ke’s. Also important – on averag – the sample companies delivered an IRR of 10.6%. The average Ke was 10.5%. There is only a 10 bps difference – and those figures were independently calculated (i.e. the IRR calculation is an observed fact; the Ke is “what an investor should expect to gain from assuming the risk of investing in a specific company”). This strong correlation of IRR’s and Ke’s is what I use to support the argument that – at least over the past 20 years – the “reversion to the mean” I mentioned above was a fact.
Those that are saying “this time is different” are ignoring that we haven’t seen yet an economic crisis – when EPS falls significantly for most companies – during this ultra-low/manipulated interest rate environment. I don’t believe the market will shrug off a widespread EPS decline: it should in fact offer great buying opportunities to those investors that are doing their homework today (after the crisis is too late to build meaningful knowledge that would allow you to quickly pull the trigger on new long positions – i.e. if you wait to start building your Circle of Competence, you will probably miss the opportunity).
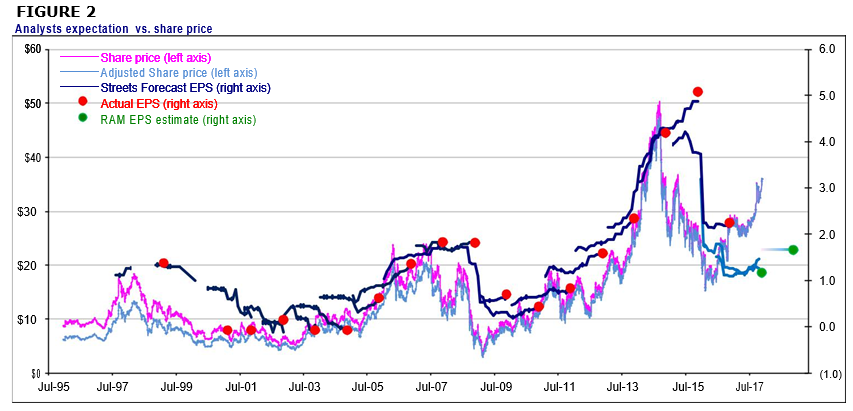
A case in point is what happened with Trinity Industries [TRN] over the past few years. Share prices went up five-fold from late 2011 until late 2014 (I’m excluding the lows of 2009 since almost everything was absurdly cheap on that year – from those low levels, prices were up 15-fold). What caused such an exponential price increase was an abnormally strong EPS cycle – figure 2 above shows the usual bias of share prices vs. short term EPS. As a reminder, this short-term bias is essential to offer fundamentals-based investors a chance to buy-low / sell-high (the other necessary condition is the “reversion to the mean” discussed above).
From a fundamentals perspective, the cause of the strong EPS cycle was an abnormal number of orders of railcars to support the new “oil by rail” phenomenon, due to the shale oil & gas revolution. To give you an idea of the magnitude of the change, around 20K barrels per day were being shipped by rail in 2009. By the end of 2014, more than 1 million barrels were being shipped per day, an increase of 50-fold. Needless to say, railroad companies were scrambling to buy and lease tankers. To add insult to injury, most of the cars being used were the old DOT-111 and not the sturdier CPC-1232 (which became the standard choice supported by new safety regulations). Even by the end of 2015 close to 100,000 DOT-111 were being used, while only 60,000 CPC-1232 were in operation. Therefore, railroad companies were also trying to retrofit some of the older railcars.
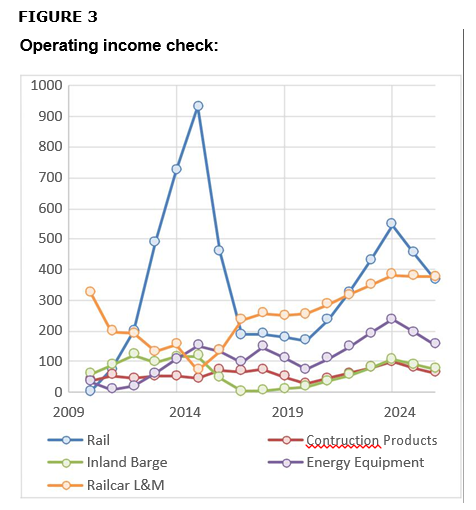
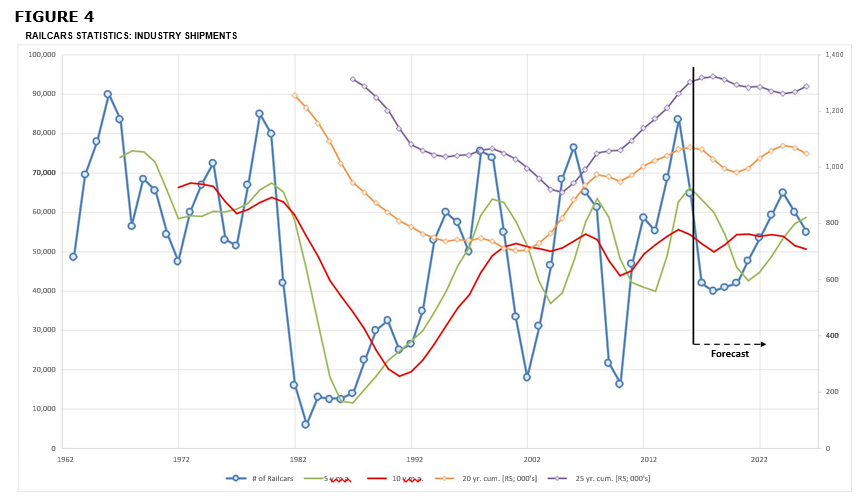
Companies like TRN (which has close to 40% of the US market of railcars), benefited a lot. Figure 3 shows TRN’s operating profit by segment – the “Rail segment” went from zero operating profit in 2009 to deliver more than $900 MM in operating profit in 2015! Quick boom and bust cycles are not new to the railcar industry. Figure 4 on the next page shows the number of rail cars shipped by manufacturing companies since the early 60s (it includes my estimates on a “base case” for the next decade).
Over the past 20 years we had three major boom-bust cycles. A diligent analyst should have had on his/her forecasts – done pre-2015/2016 – (i) for sure a bust, (ii) maybe another boom, but (iii) certainly an eventual normalization of shipments. Nevertheless, most were keeping EPS forecast at very high levels and were “disappointed” when it became clear that EPS for 2016 (and 2017 or even beyond) was not going to be at abnormally high levels.
The EPS decline was inevitable – normalization would be achieved not only because, eventually, manufacturing companies would deliver all the necessary tankers but also because an over-supply of oil (even if momentary) could drag the commodity’s prices down, making exploration by some shale fields unprofitable. Well, that was exactly what happen in 2014/2015. Nevertheless, “The Market” was pricing TRN as if the boom would never end.
By early 2016, TRN shares were below what I consider a “low case” scenario. At that point, the offered IRR [Internal Rate of Return] for an investor that was willing to own the business forever (think Warren Buffett buying 100% of the company) was at 16.4%, assuming my base case would happen. Here is the inconsistency with the idea of an eternal plateau of US equities prices: how come a company that was created in 1933 (i.e. they have gone through a lot) and for sure would survive one of the many busts in its industry could offer double-digit returns when 10 year bonds yields were close to 2%? The reality is that “fear” trumps everything else – if EPS is falling, share prices fall. If it happened with TRN, why wouldn’t it happen with other companies?
That is why I say that TRN is a cautionary tale – it shows that share prices should fall, for most companies, when EPS falls during the next economic hiccup. On TRN’s case, their EPS decline was just moved forward by a sector-specific crisis. So there is nothing different this time – i.e. we are not waiting for a “black swan” to show up and offer compelling buying opportunities (and also its twin brother “terrible returns for those that were all-in long during the peak”). We are just waiting to the white-swans to complete their usual migratory pattern and show-up in droves!
As always, happy to talk more about this subject or anything related to the companies in my Circle of Competence.
About The Author: Danilo Santiago
Danilo Santiago is the founder of Rational Investment Methodology (RIM), that focuses on a quasi-static group of approximately 60 publicly traded, liquid US stocks - most of these companies, defined as RIM’s Circle of Competence, have been followed for more than a decade. RIM employs extensive industry research and analysis, building highly detailed proprietary discounted-dividend models, which are used to determine “fair values” of companies based on different scenarios. Lastly, RIM constructs “rules-based” model portfolios (long-short, long-only or long- aggressive) with a company-specific margin of safety relative to “fair value”, using its proprietary Odysseus Portfolio Construction Tool. Selected model portfolios are replicated into clients’ accounts, using Interactive Brokers’ platform, adjusting the number of shares in each client’s portfolio in a pari-passu manner. Mr. Santiago is a MBA from Columbia University and has a B.S. in Electrical Engineering from the University of São Paulo.
More posts by Danilo Santiago