This article is authored by MOI Global instructor Phil Ordway, Managing Principal at Anabatic Investment Partners, based in Chicago, Illinois.
Our bank investments remain anchored by OceanFirst (OCFC). I remain optimistic on OCFC’s prospects, as well as the opportunities in the sector overall. The KBW Nasdaq Bank Index declined 19.2% in 2018 while the S&P 500 Financials fell 14.7%.[1] It is ironic, to say the least, that market prices dropped in a year featuring a large tax cut and the ongoing “normalization” of interest rates (to say nothing of very benign credit conditions, decent growth, and a generally sound economy). This is yet another example of expectations trumping all else, and why I find it more reliable to consider multi-year business value as the key investment barometer.
The overwhelming majority of individual banks I follow also saw significant declines in the market price of their equity during 2018, but those declines imply dour fundamentals in 2019 and beyond. I am not dismissive of the chances of a recession this year – or any year – but when a recession inevitably arrives most banks will face it with good credit profiles, ample reserves, and plenty of liquidity. Earnings will decline as many banks add to credit reserves and slow or reverse asset growth, but that is normal.
I will repeat my comment of recent years: I see the U.S. banking industry as better capitalized and safer overall than at any other point in its modern history. Regardless of what the economy produces in 2019, much lower security prices and a suddenly gloomy market temperament offer an attractive opportunity over the next several years.
*******
OCFC shares returned (12.3%) during 2018 – including a (12.7%) result in December alone – but the company made progress in its business. The acquisition of Sun Bancorp closed in January 2018 and was well integrated by the fall. In October, OceanFirst also announced its acquisition of Capital Bank of New Jersey for $80 million.[2] It is a small deal but nonetheless an excellent fit from an operational, geographic, and financial perspective.
It is important to remember that OceanFirst has a stable, low-cost deposit base paired with conservative credit and lending profile. As interest rates have increased the company has benefited from its deposit franchise – the cost of deposits has lagged rate increases to an impressive degree, all while the bank has increased its share of funding from core deposits – and yet the market’s valuation on those deposits has fallen by about half.[3]
When the economy does enter a downturn, the company will benefit from its credit discipline and excess liquidity, having intentionally avoided overconcentration in commercial real estate and loans with weak structures. And as we wait to see how macro conditions will develop, OCFC is plowing ahead with its profitable, efficient operation. Credit quality is excellent, with non-performers at just 0.3% of total assets. Net income is running close to 1.2% on assets and 15% on tangible common equity, and the company’s efficiency ratio is in the low-50% range, a level on par with the best community banks in the country. I remain impressed by CEO Chris Maher and his team, and their strategy should work well in a variety of future environments.
At a current earnings yield of approximately 10%, the expectations baked into the stock price are low. I am as vigilant as ever for signs of credit deterioration, a degradation of the culture, or management mistakes, but other than some marginal reallocation to new opportunities I expect to hold our OCFC investment for the foreseeable future.
A brief update on our other community bank investments:
Bank H was a new investment in 2017. This bank navigated a boom-and-bust in the local economy, producing excellent credit results and good profits along the way. It also has a large, low-cost deposit base that would be very valuable to an acquirer. A sale of the company remains possible but looks less likely than it did a year or two ago. The recent market price for this investment implied very low expectations, and our decision to hold, buy more, or sell in favor of a better opportunity will be determined by the investment prospects here weighed against our other options.
Bank I was a new investment in the second quarter of 2018. It remains a very small position as we paused our buying to pursue other opportunities. This bank has made progress in recent years by keep a lid on expenses and leveraging its net interest income. Depending on the company’s prospects and the other opportunities available during 2019 I would expect to increase our investment or sell the shares we currently hold.
The following table reflects our current holdings in community banks as of December 31, 2018.
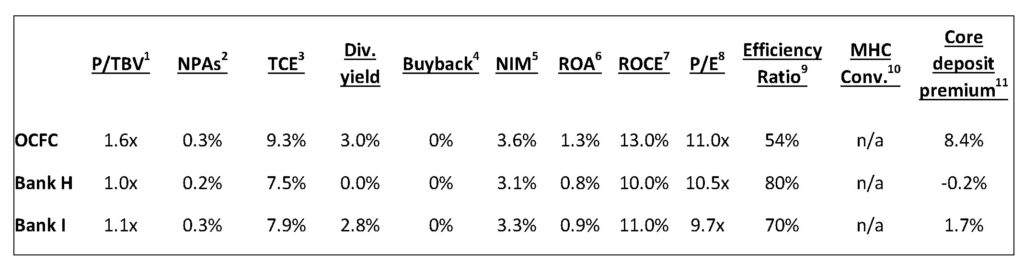
Price data as of 2 January 2019. Sources: SEC filings, Call Reports, FactSet, and Anabatic estimates.
Figures reflect the most recently reported quarter and are adjusted and estimated as applicable to reflect current annualized levels.
1 Market price divided by tangible book value, as reported
2 Non-performing assets (non-performing loans + foreclosures / other real estate owned) divided by total assets, as reported
3 Tangible common equity divided by tangible assets, as reported
4 Estimated percentage of the company’s current shares outstanding likely to be repurchased under existing buyback authorization
5 Net interest margin, adjusted and annualized
6 Return on assets, adjusted and annualized
7 Return on common equity, adjusted and annualized
8 Market price divided by net income per share, adjusted and annualized
9 Efficiency Ratio = non-interest expenses divided by the sum of net interest income and non-interest income, as reported
10 Mutual holding company conversion — the year in which the company converted to public ownership
11 The core deposit premium is the excess of equity market value over tangible book value, expressed as a percentage of core deposits
[1]Both are indices presented for reference only, and the latter is even less relevant than the former. Both figures include dividends. Source: Nasdaq and Standard & Poor’s.
[2]CANJ provides an excellent funding base with a 0.46% average cost of deposits and a 70% loan-to-deposit ratio. It is also surprisingly profitable, posting a trailing ROA of over 1.3% and ROTCE of over 14% (on a reasonable level of 9.2% tangible common equity). The efficiency ratio of 55% and near absence of non-performing assets – 0.08% at the recent quarter – point to an operational fit as well. The worst thing I can find about the deal is that it wasn’t big enough to make a large difference for OceanFirst overall.
[3]As noted in previous letters, approximately 85% of OceanFirst’s total deposits are “core” deposits and the total cost of deposit funding in the third quarter of 2018 was just 39 basis points – 0.39% – up from 33 basis points in the first quarter and 29 basis points in the prior year period. The core deposit premium stood at approximately 8% at December 31, 2018, down from 16% at June 30, 2018.
Disclaimer: Gross Long and Gross Short performance attribution for the month and year-to-date periods is based on internal calculations of gross trading profits and losses (net of trading costs), excluding management fees/incentive allocation, borrowing costs or other fund expenses. Net Return for the month is based on the determination of the fund’s third-party administrator of month-end net asset value for the referenced time period, and is net of all such management fees/incentive allocation, borrowing costs and other fund expenses. Net Return presented above for periods longer than one month represents the geometric average of the monthly net returns during the applicable period, including the Net Return for the month referenced herein. An investor’s individual Net Return for the referenced time period(s) may differ based upon, among other things, date of investment. In the event of any discrepancy between the Net Return contained herein and the information on an investor’s monthly account statement, the information contained in such monthly account statement shall govern. All such calculations are unaudited and subject to further review and change. For purposes of the foregoing, the calculation of Exposure Value includes: (i) for equities, market value, and (ii) for equity options, delta-adjusted notional value.
THE INFORMATION PROVIDED HEREIN IS CONFIDENTIAL AND PROPRIETARY AND IS, AND WILL REMAIN AT ALL TIMES, THE PROPERTY OF ANABATIC INVESTMENT PARTNERS LLC, AS INVESTMENT MANAGER, AND/OR ITS AFFILIATES. THE INFORMATION IS BEING PROVIDED SOLELY TO THE RECIPIENT IN ITS CAPACITY AS AN INVESTOR IN THE FUNDS OR PRODUCTS REFERENCED HEREIN AND FOR INFORMATIONAL PURPOSES ONLY.
THE INFORMATION HEREIN IS NOT INTENDED TO BE A COMPLETE PERFORMANCE PRESENTATION OR ANALYSIS AND IS SUBJECT TO CHANGE. NONE OF ANABATIC INVESTMENT PARTNERS LLC, AS INVESTMENT MANAGER, THE FUNDS OR PRODUCTS REFERRED TO HEREIN OR ANY AFFILIATE, MANAGER, MEMBER, OFFICER, EMPLOYEE OR AGENT OR REPRESENTATIVE THEREOF MAKES ANY REPRESENTATION OR WARRANTY WITH RESPECT TO THE INFORMATION PROVIDED HEREIN. AN INVESTMENT IN ANY FUND OR PRODUCT REFERRED TO HEREIN IS SPECULATIVE AND INVOLVES A HIGH DEGREE OF RISK. THERE CAN BE NO ASSURANCE THAT THE INVESTMENT OBJECTIVE OF ANY SUCH FUND OR PRODUCT WILL BE ACHIEVED. MOREOVER, PAST PERFORMANCE SHOULD NOT BE CONSTRUED AS A GUARANTEE OR AN INDICATOR OF THE FUTURE PERFORMANCE OF ANY FUND OR PRODUCT. AN INVESTMENT IN ANY FUND OR PRODUCT REFERRED TO HEREIN CAN LOSE VALUE. INVESTORS SHOULD CONSULT THEIR OWN PROFESSIONAL ADVISORS AS TO LEGAL, TAX AND OTHER MATTERS RELATING TO AN INVESTMENT IN ANY FUND OR PRODUCT.
THIS IS NOT AN OFFER TO SELL OR SOLICITATION OF AN OFFER TO BUY AN INTEREST IN A FUND OR PRODUCT. ANY SUCH OFFER OR SOLICITATION WILL BE MADE ONLY BY MEANS OF DELIVERY OF A FINAL OFFERING MEMORANDUM, PROSPECTUS OR CIRCULAR RELATING TO SUCH FUND AND ONLY TO QUALIFIED INVESTORS IN THOSE JURISDICTIONS WHERE PERMITTED BY LAW.
ALL FUND OR PRODUCT PERFORMANCE, ATTRIBUTION AND EXPOSURE DATA, STATISTICS, METRICS OR RELATED INFORMATION REFERENCED HEREIN IS ESTIMATED AND APPROXIMATED. SUCH INFORMATION IS LIMITED AND UNAUDITED AND, ACCORDINGLY, DOES NOT PURPORT, NOR IS IT INTENDED, TO BE INDICATIVE OR A PREDICTOR OF ANY SUCH MEASURES IN ANY FUTURE PERIOD AND/OR UNDER DIFFERENT MARKET CONDITIONS. AS A RESULT, THE COMPOSITION, SIZE OF, AND RISKS INHERENT IN AN INVESTMENT IN A FUND OR PRODUCT REFERRED TO HEREIN MAY DIFFER SUBSTANTIALLY FROM THE INFORMATION SET FORTH, OR IMPLIED, HEREIN.
PERFORMANCE DATA IS PRESENTED NET OF APPLICABLE MANAGEMENT FEES AND INCENTIVE FEES/ALLOCATION AND EXPENSES, EXCEPT FOR ATTRIBUTION DATA, TO THE EXTENT REFERENCED HEREIN, OR AS MAY BE OTHERWISE NOTED HEREIN. NET RETURNS, WHERE PRESENTED HEREIN, ASSUME AN INVESTMENT IN THE APPLICABLE FUND OR PRODUCT FOR THE ENTIRE PERIOD REFERENCED. AN INVESTOR’S INDIVIDUAL PERFORMANCE WILL DIFFER BASED UPON, AMONG OTHER THINGS, THE FUND OR PRODUCT IN WHICH SUCH INVESTMENT IS MADE, THE INVESTOR’S “NEW ISSUE” ELIGIBILITY (IF APPLICABLE), AND DATE OF INVESTMENT. IN THE EVENT OF ANY DISCREPANCY BETWEEN THE INFORMATION CONTAINED HEREIN AND THE INFORMATION IN AN INVESTOR’S MONTHLY ACCOUNT STATEMENT IN RESPECT OF THE INVESTOR’S INVESTMENT IN A FUND OR PRODUCT REFERRED TO HEREIN, THE INFORMATION CONTAINED IN THE INVESTOR’S MONTHLY ACCOUNT STATEMENT SHALL GOVERN.
NOTE ON INDEX PERFORMANCE: INDEX PERFORMANCE DATA AND RELATED METRICS, TO THE EXTENT REFERENCED HEREIN, ARE PROVIDED FOR COMPARISON PURPOSES ONLY AND ARE BASED ON (OR DERIVED FROM) DATA PUBLISHED OR PROVIDED BY EXTERNAL SOURCES. THE INDICES, THEIR COMPOSITION AND RELATED DATA GENERALLY ARE OWNED BY AND ARE PROPRIETARY TO THE COMPILER OR PUBLISHER THEREOF. THE SOURCE OF AND AVAILABLE ADDITIONAL INFORMATION REGARDING ANY SUCH INDEX DATA IS AVAILABLE UPON REQUEST.
About The Author: Philip Ordway
Philip Ordway is Principal and Portfolio Manager of Anabatic Fund, L.P. Previously, Philip was a partner at Chicago Fundamental Investment Partners (CFIP). At CFIP, which he joined in 2007, Philip was responsible for investments across the capital structure in various industries. Prior to joining Chicago Fundamental Investment Partners, Philip was an analyst in structured corporate finance with Citigroup Global Markets, Inc. from 2002 to 2005, where he was part of a team responsible for identifying financing solutions for companies initially in the global power and utilities group and ultimately in the global autos and industrials group. Philip earned his M.B.A. from the Kellogg School of Management at Northwestern University in 2007 and his B.S. in Education & Social Policy and Economics from Northwestern University in 2002.
More posts by Philip Ordway