This article is authored by MOI Global instructor Javier Lopez Bernardo, portfolio manager and senior investment analyst at BrightGate Capital, based in Madrid.
Javier is an instructor at Best Ideas 2024.
At the risk of sounding like a broken record, the valuations of most developed economy market equity indices (with the possible exception of the UK and a few other countries) remain at the highest levels in history, regardless of which metric is used (sales, gross margins, profits, Tobin’s q) and which normalisation factor is applied (CAPE, last year’s earnings, forward earnings, etc.). Historical experience shows that excessive valuations always lead to poor future returns, due to the simple fact of financial mathematics, which shows that one of the determinants of returns is the original purchase price.
What is most surprising, however, is not that valuations are in bubble territory, but that valuations are at the same level as in 2021 (which was already dramatically high), but with substantially higher interest rates. Clearly, the rise in interest rates has not had the effect that conventional financial theory would suggest. The other monetary variables through which central banks implement monetary policy, such as the size of their balance sheet, have also been more restrictive in relative terms compared to 2021 (although disagreement among analysts on this point), adding more unknowns as to what may be behind all this speculative process.
I would like to pause to analyse the role that investor psychology may be playing in this whole process. This is not a subject I like to talk about lightly, especially given my background as a macroeconomist (in macroeconomics we like to think that by modelling a few aggregate variables we can understand the behaviour of many other variables) and the fact that the effects of psychology on the economy are generally difficult to quantify.
On this last point, a branch of economics known as experimental economics, popularised by the economist Vernon Smith (who shared the 2002 Nobel Prize in Economics with Daniel Kahneman), has made great strides in recent decades in studying the formation of asset prices under laboratory conditions. For the purposes of this letter, I will only mention some of the findings of experimental economics on the formation of financial asset prices.
The classic experiment consists of gathering a group of participants, giving them an initial endowment of cash (say, dollars) and shares (not all receive the same ratio of cash to shares, but they do receive the same monetary value), and letting them buy and sell freely. The experiments last for fifteen rounds. At the beginning of each round, participants start trading their assets, and at the end of the round all the trades are tallied and the average price at which the trades occurred is calculated.
The key to understanding why such experiments are so illustrative is the way in which potential stock returns are determined. It is assumed that the stock pays a random dividend in each round, and that at the end of the fifteen rounds the stock has no residual value; in other words, the stock is only valuable in terms of the dividends it pays.[1] The most typical form usually adopted by those designing the experiment is to assume that the stock dividends follow the following probability function:
That is, in each round, the expected dividend is $24. It doesn’t take a genius to work out that the intrinsic value of this simple stock at the start of the game should be $24 x 15 = $360, and that this value will drop monotonically over the rounds by the amount of the average dividend.
What is really interesting about these experiments is that this simple setup leads participants to make erroneous valuations of the asset – and by a huge margin.
For example, the graph below shows one such experiment, the results of which were published in 2016. The descending black line shows what the intrinsic value should be in each round of the game, while the other lines show the participants’ current behaviour. The green line shows the bubble that would occur in a neutral emotional state for the participants. As the game progresses, the bubble swells more and more in terms relative to the intrinsic value of the stock, until in round 9 the average price participants are willing to pay is $400, while the intrinsic value is around $175, implying an overvaluation of 2.3 times!
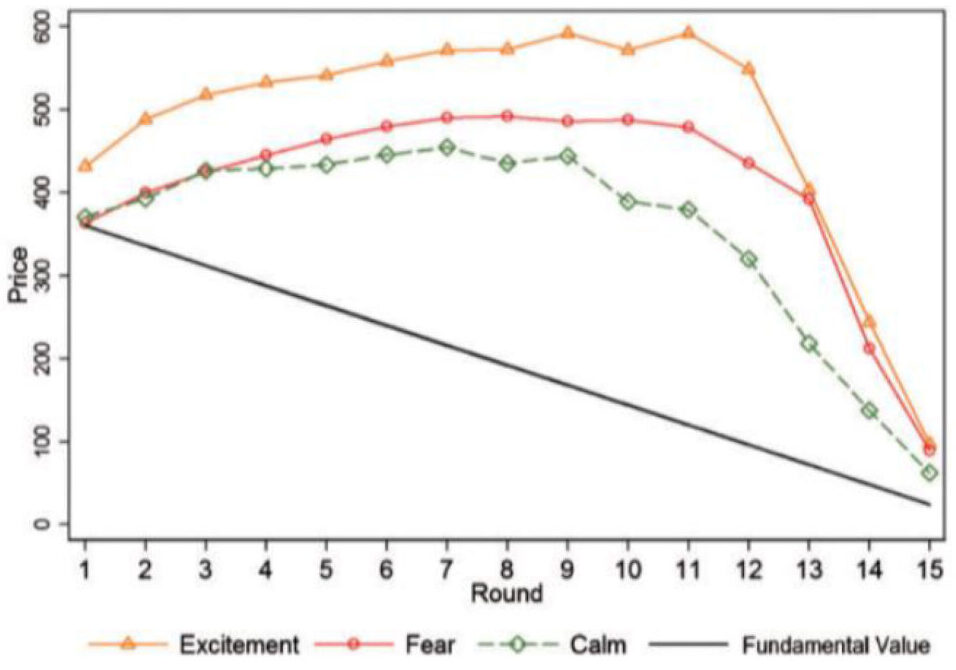
Source: Andrade et al. (2016), Bubbling with Excitement: An Experiment, p.453.
The results are even more grotesque if at the beginning of the experiment the participants are subjected to tests that icnrease their level of euphoria (yellow line) or fear (red line). In these cases, the bubbles inflate further and take longer to adjust; in fact, they never quite adjust, since in the last round, for example, the average price at which trades are executed is around $100, compared with an intrinsic value of $24 (the expected value of a single dividend).
Curiously, even in a state of fear, participants are susceptible to being swept up in the collective euphoria – the fear of missing out effect in all its glory!
Experimental economics has conducted many such games in recent decades, using small variations in the initial setup of the experiment to determine the extent to which certain factors determine the behaviour of bubbles. Some of the main factors that have been documented to facilitate the emergence, size and intensity of a bubble are:
- The proportion of experienced versus inexperienced participants. Obviously, the more people participate in the experiment, the more accurate their stock valuations become.
- A more uncertain statistical distribution of the dividend.
- A statistical distribution of the dividend that includes the probability, albeit small, of outsize potential returns.
- Buying on margin is allowed.
- Interestingly, the possibility of short selling. Although short sellers tend to have a better understanding of the fundamental price of the stock in these experiments, they tend to start shorting very early, and then have to cover their losses at the peak of the bubble, which is thus prolonged over time.
The results of these experiments have profound implications for the functioning of markets in the real world because, as we have seen, bubbles can form even in simple environments. It is obviously difficult to know the extent to which any of these conditions are present in the real world, but I have no doubt that after a decade of easy money, financial market participants are clearly feeling exuberant.
I also believe that there are other factors behind the gains in equity indices so far this year. The proportion of people with little experience in the markets may be higher than ever (as evidenced by the rise of platforms such as Robin Hood and the retail investor), uncertainty is high (geopolitics, viruses, supply chains etc), the ability to buy and sell assets with highly skewed statistical distributions is also at high levels (as evidenced by the recent casino around the buy/sell of zero days to expiry options) and finally short sellers who have recently thrown in the towel by having to close out their positions.
Experimental economics can tell us why a bubble is forming, but unfortunately it cannot tell us how long it will last. In my view, and as I explain below, the best way to protect ourselves from these events is simply to be invested in assets that are free of these dynamics and in which we have confidence that their intrinsic value will continue to rise over time.
[1]In fact, as there are no interest rates or discount rates (the fifteen rounds are played back-to-back), the experiment is considerably simplified by relieving participants of the tedious task of discounting future dividends.
About The Author: Javier López Bernardo
Javier López Bernardo is currently Portfolio Manager (equities and high yield) at BrightGate Capital SGIIC, an independent asset management boutique company based in Madrid, Spain.
He holds a Bachelor in Business Administration (major in finance) by the Universidad Complutense de Madrid, a Master in Corporate Finance and Investment Banking by the IEB and a Master in Economics by Kingston University, where he also earned a Ph.D. in Economics. His academic research on equity markets and growth theory has been published in leading international journals.
Additionally, he has been a full-scholarship holder for two years by the Ramón Areces Foundation and he is a CFA charterholder. He is a lecturer for the CFA program and he also regularly delivers lectures in commodities and value investing.
More posts by Javier López Bernardo