This article is excerpted from a letter by MOI Global instructor Daniel Gladis, chief executive officer of Vltava Fund.
Several years ago, we began showing a graph with two curves during our presentations at annual shareholder meetings and in the autumn seminars. One curve shows the change in the Fund’s NAV and the other the development of the value of the Fund’s entire portfolio as we estimate it continuously over time at weekly intervals. We have been publishing this graph twice a year, and in the meantime your requests for more up-to-date value developments were increasing. This past July, we therefore decided to begin providing current estimates of the portfolio’s value in the fact sheet you receive from us every month, right next to the current NAV. You thus will be able continuously to picture the difference between NAV and the portfolio’s value, in other words, how inexpensive are the shares you hold through the Fund, and also what this all means concerning probable future returns. This is a rather fundamental step, and that is why I want now to discuss what this portfolio value actually is, how it is estimated, and why it is important.
A company’s value
We believe the only logical way to invest is to pay a price that is lower than the value that we get in return. This rule should be universal and should apply for all types of investments, not just equities. Price and value are two different categories. Price is usually clear. In the case of equities, one has only to look at the current price on the stock exchange. That is determined by the momentary levels of supply and demand for the given stocks, and is the same for everybody. It is more difficult with value. Theoretically, the value of each asset is equal to the present value of all cash flows that the asset’s holder will receive in the future.
It is not quite so easy, however, to apply this simple definition in practice. Among other things, one has to estimate the company’s free cash flows into the future. That future is very long for stocks, because stocks theoretically have a lifetime that is infinite. That means more than half the value of the vast majority of the analysed companies derives from cash flows more than seven years into the future. Anyone who has ever managed a company knows that such long projections are highly unreliable and often are more indicative of the analyst’s subjective opinions than of the company actually being analysed.
The fact that something is difficult, however, does not mean that it is impossible. In analysing individual companies and determining their value, we proceed from two basic conditions: Analysing a company makes sense only if, first, what we are trying to determine in that analysis is actually determinable and, second, if it is at the same time sufficiently important. In establishing the values of companies, we therefore avoid those for which estimating their values takes on a semblance of gazing into a crystal ball. This includes companies which are non- transparent, unstable, financially weak, too young, or with unpredictable management, but also those for which determining their value requires looking into a too-distant future. We are aware that our estimate of the value of such a company would be very unreliable and therefore practically worthless.
Instead, we endeavour to focus on companies that are well-established, stable, transparent, financially strong, having consistent management, and that already produce very strong free cash flows, as those cash flows give us something upon which our analysis can be based. Even though they still contain a substantial dose of subjectivity, the estimates of such companies’ values can be utilised in putting together a portfolio.
The objective of the entire analytical process is not to establish a company’s value with exacting precision. That is impossible, and it is not even important. What is important is that we become convinced that the company’s value is substantially greater than is its price. For this purpose, we do not need to establish a precise value. We just need to estimate a range within which the company’s value probably lies. Its lower limit represents our conservative estimate. If this is substantially higher than the share price, then that information is sufficient.
Development of value and risk
A company’s value is not static, but rather it changes over time. It increases over the long term for equities as a whole, and this explains why share prices also grow substantially over the long term. This is because (whether we speak of individual stocks or the market as a whole) stock value draws the share price or prices towards it over the long term. But there are great differences among individual stocks. Value increases for some, diminishes for others, and stays about unchanged for still others. For some stocks, it changes slowly, and for others it leaps up dramatically. Compare, for example, the long-term price developments for JP Morgan and Deutsche Bank, Berkshire Hathaway and Immofinanz, or Apple and Nokia. The developments of these companies’ values eventually exerted a pull on their prices, and the differences are dramatic. If there is one thing a person can rely upon in equity markets it is the fact that price follows the development of a company’s value over the long term. Sometimes it takes a very long time for this to happen, but it always happens eventually. The selection of stocks matters really a lot, however. When picking stocks, we are interested not only in what is a company’s value today, but most of all where it will go in the future.
The growth in value is very important. If the current difference between price and value is large but value is increasing only very slowly, then in our investing we have to rely on the difference between price and value narrowing very quickly. We sometimes enter into such investments, but we like much more those where the difference between price and value is large and at the same time value is increasing rapidly. Then we can say that time is on our side and we just have to hold and wait. Best of all are those investments where value is growing rapidly but we need not pay much for that growth, when the share price is at such a level that we receive the future growth practically for free. There is usually very low risk associated with such investments, because we are not dependent on the future’s developing in accordance with how we envision it.
What does this all look like in practice for us?
The crux of our work lies in studying one company after the other. In the more than 14 years of the Fund’s existence, we have studied 1904 such companies from 64 countries. We then remove those we do not understand, those whose business we do not like, and those for which the value estimate is highly unreliable. Most companies fall into one or more of these categories. In the majority of cases there is no need to come back to these, because an unattractive business usually will remain unattractive. There still remains a sufficient number of companies regarding which we feel we understand what they do, whose businesses we like, and whose value can somehow be estimated. Such companies we study continuously year to year. There are many companies about which we have a history going back more than a decade, and even 25 years for some. The outcome of all this analytical activity is a list of good companies with a value estimate for each. We then select stocks for our portfolio from this list. Because we are not the only investors seeking good companies, the prices of these stocks are mostly at or above our estimated values. With a little self-discipline and patience, however, we can wait until we see a share price move substantially below its value – and that is the signal to buy.
We use various valuation models for different types of companies. These are not in and of themselves very complicated, but they are supported by rather extensive analysis of the given companies, their entire sectors, and their competitor companies. It would make this letter to shareholders unbearably long to describe specific valuation methods, so I will not do so here. We are planning to focus on them during our October seminar. So let’s skip over this step here and look at one concrete result of our analyses.
In the following graph, you can see the development of the Berkshire Hathaway share price and the development of our estimate of the share’s value, as well as points in time at which we bought it.
Development of value and price, Berkshire Hathaway, BRK-A (2002–2018)
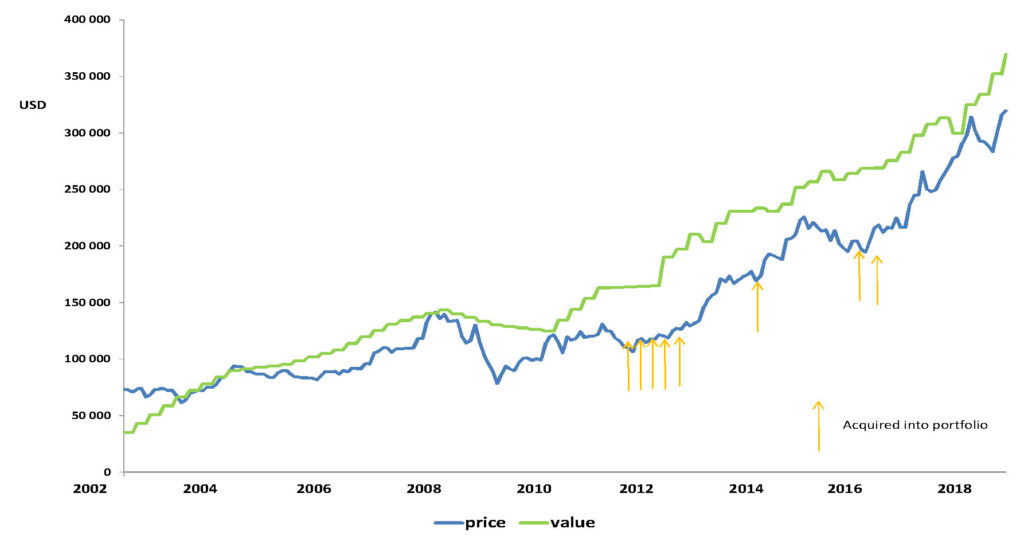
Berkshire Hathaway has been our largest position for a long time and also is one of our oldest. Several conclusions can be made from examining the graph:
1. The stock’s value is increasing over the long term, even though the long- term growth is interspersed with shorter periods of stagnation or decline.
2. Share price follows the development of value over the long term.
3. The development of price is much more volatile than is the development of value. A temporary drop in price by 40% would in no way be exceptional.
4. From a long-term perspective, the price volatility loses some of its importance, but this is a source of buying opportunities when the spread between price and value widens to more than usual.
This is the key idea of our investment philosophy: The main long-term objective we monitor in selecting stocks is the growth in their value and growth in the value of the portfolio as a whole. Most of the time we ignore movements in share prices, but at times when they diverge extremely from the value we can utilise them for buying or selling.
In the case of Berkshire Hathaway, our analyses lead us to conclude that the share’s value will exceed USD 400,000 during 2019, and that should create a sufficiently strong pull for further price growth. Berkshire’s share value is currently about 15% greater than its price. That is a much smaller difference than between the value and price of our portfolio as a whole (which is currently about 40%). If we consider, however, that the development of Berkshire’s value is relatively well foreseeable and that the entire company’s business bears a substantially below-average risk, this creates a combination that seems to us very attractive.
(By the way, I also have my private prediction for when Berkshire share value will exceed USD 1,000,000. I enjoy playing with numbers, and this is an internal test of mine to see how wide of the mark I can be when I attempt to look far ahead into the future. I now estimate that this will happen a year earlier than when I first estimated it two years ago. So far it seems I was originally too conservative. We’ll see.)
Value of the portfolio as a whole
Because we have estimates of the individual companies’ values, we can easily calculate the value of the Fund’s portfolio as a whole, which is the number we now state also in the monthly fact sheets. Its amount and development are influenced primarily by the following factors:
1. The selection of the individual companies for the portfolio, their representation in the portfolio, and the prices at which we acquire them. The more undervalued companies we successfully find and the more diligent we are about making sure to buy them at prices discounted to deeply below their values, the better.
2. The development of the individual companies’ values over time. It is not enough just to buy a stock that appears to be cheap. The important thing is where its value will move over time. The sooner that value grows, the stronger will be the draw it exerts upon the share price.
3. Portfolio turnover. When the price of some stock we are holding rises to or even above its value, we can sell it and replace it with another having a more favourable price/value ratio. These transactions can contribute substantially to growth in the portfolio’s value if they are made shrewdly and while maintaining a long-term perspective.
4. Currency movements. Even though currency movements have minimal impacts on the Fund’s NAV because most of the currency risk is hedged, they do have short-term effects on portfolio value because they create transient unrealised loss or gain from currency swaps and forwards, and this is reflected in the Fund’s value.
5. Additional smaller influences come from dividends received (positive), gains or losses from option trades (predominantly positive), and the Fund’s operating costs (negative).
Of course, still one important subjective factor needs to be added to these objective factors, and that is our own idea as to the value of the individual companies. We cannot say with complete certainty whether we are too optimistic or pessimistic in our estimates. Moreover, it can be neither confirmed nor refuted a priori whether we are approximately correct in our estimates or entirely wrong. It is impossible to determine the objective truth. A subjective view will always prevail, but that is the very nature of investing. It comes down to reaching a conclusion on the basis of one’s rational analysis and then investing on that basis.
If we look several back years, we can find many cases when our value estimates for the individual companies were excessively conservative and low, but also cases when they were exaggerated. Therefore we had to correct them over time. On average, however, they turned out to be pretty reliable based on the companies’ earning performances in subsequent years. At that point, once we know how that future actually turned out, we receive feedback indicating how near or distant we had been in our initial estimates of value compared to reality.
This is why we have not three companies in our portfolio but 19. It is probable that we are quite wrong in our estimates of value for some of them (and we do not even know whether we are over- or underestimating the value), but this error will be much smaller in the portfolio as a whole. In other words, we diversify the portfolio to a reasonable extent.
It may seem academic to rely on company value, but this is used more often in practice than you might think. A good example can be seen in the case of private equity funds. They hold shares in companies that are not publicly traded and which therefore cannot be valued according to their current prices. Instead, they are valued on the basis of models, which in other words means by estimating their values. While we use value estimates only as an internal indicator, private equity funds use them to establish fund NAV, for valuation in relation to subscribing new shares, and also for calculating fees. And yet, this is something few people call into question.
I sometimes say that private equity funds have rather comfortable lives. Calculating NAV on the basis of their own models allows them completely to avoid price volatility on the markets and thereby to create the impression of greater stability. If we could calculate our fund’s NAV using the same method, we would be in positive-gains territory every month. I would not want to trade places, though, because it is that very volatility of share prices on the public markets that is the source of large and readily exploitable opportunities which private equity funds do not have.
How to work with the information about portfolio value
We believe that the information on the Fund’s portfolio value is an important piece of the information mosaic you regularly receive from us. Its level indicates where the Fund’s NAV should be headed in future. The difference between value and NAV also suggests something about the degree of risk that is associated with holding our portfolio. Price is always one of the crucial parameters in managing risk, and a larger difference between NAV and value not only increases expected return but also reduces risk.
I consider portfolio value 25% higher than NAV to be a healthy, normal level. If you see this difference substantially narrow, it means that the portfolio is becoming more expensive, that we are struggling to find sufficient attractive investment opportunities, and probably that we are also holding more cash than usual. At such times, you should postpone increasing your investments into the Fund. On the other hand, when you see that the difference between value and NAV is substantially greater, this means that the portfolio is attractively valued and that there are plenty of good investment opportunities. This also is a time during which you ideally should direct your potential additional investments into the Fund.
Changes in the portfolio
Over the summer, we wanted to narrow the Fund’s portfolio a little. We sold two positions: Navient and Resona Holdings.
We had begun buying Navient in 2014 after it was spun off from Sallie Mae and started to be traded on the exchange on its own. The stock did very well initially, but we failed to take advantage of that by selling. To put it in hockey jargon, we overextended our shift and did not sell the stock until this year. Our gain was 12%, and that is a disappointment for us. We should have handled this more shrewdly.
Resona Holdings is a Japanese bank and an interesting restructuring story. Unfortunately, because of persisting very low interest rates in Japan, interest rate margins have narrowed so much for the local banks that in an effort to achieve higher returns they are forced to take on greater risks than seem reasonable to us, and therefore we thought it better to sell the stock. Our return was 40%.
We used the money from these two sales primarily to strengthen some existing and more attractive positions in the portfolio.
Disclaimer: This document expresses the opinion of the author as at the time it was written and is intended exclusively for educational purposes. The information contained in this letter to shareholders may include statements that, to the extent they are not recitations of historical fact, constitute “forward-looking statements” within the meaning of applicable foreign securities legislation. Forward- looking statements may include financial and other projections, as well as statements regarding our future plans, objectives or financial performance, or the estimates underlying any of the foregoing. Any such forward-looking statements are based on assumptions and analyses made by the fund in light of its experience and perception of historical trends, current conditions and expected future developments, as well as other factors we believe are appropriate in the given circumstances. However, whether actual results and developments will conform to our expectations and predictions is subject to a number of risks, assumptions and uncertainties. In evaluating forward-looking statements, readers should specifically consider the various factors which could cause actual events or results to differ materially from those contained in such forward-looking statements. Unless otherwise required by applicable securities laws, we do not intend, nor do we undertake any obligation, to update or revise any forward-looking statements to reflect subsequent information, events, results or circumstances or otherwise. This letter to shareholders does not constitute or form part of, and should not be construed as, any offer for sale or subscription of, or any invitation to offer to buy or subscribe for, the securities of the fund. Before subscribing, prospective investors are urged to seek independent professional advice as regards both Maltese and any foreign legislation applicable to the acquisition, holding and repurchase of shares in the fund as well as payments to the shareholders. The shares of the fund have not been and will not be registered under the United States Securities Act of 1933, as amended (the “1933 Act”) or under any state securities law. The fund is not a registered investment company under the United States Investment Company Act of 1940 (the “1940 Act”). The shares in the fund shall not be offered to investors in the Czech Republic on the basis of a public offer (veřejná nabídka) as defined in Section 34 (1) of Act No. 256/2004 Coll., on Capital Market Undertakings. The Fund is registered in the Czech National Bank´s list in the category Foreign AIFs authorised to offer only to qualified investors (without EuSF and EuVECA) managed by AIFM. Historical performance over any particular period will not necessarily be indicative of the results that may be expected in future periods. Returns for the individual investments are not audited, are stated in approximate amounts, and may include dividends and options.
About The Author: Daniel Gladis
Daniel Gladis, based in the Czech Republic, has amassed a market-beating track record since starting VLTAVA Fund in 2004. VLTAVA Fund is a value-oriented, research-driven investment fund focused on investing in good companies run by quality management. Previously, Daniel was Director and Chairman of the Board of Directors of ABN AMRO Asset Management (Czech) from 1999–2004. He was also Director and founder of Atlantik finanční trhy, a.s., a member of the Prague Stock Exchange. Daniel is a graduate of VUT Brno and has authored the best-selling book Naučte se investovat (Learn to Invest).
More posts by Daniel Gladis