This article is authored by MOI Global instructor Steve Gorelik, portfolio manager at Firebird Management.
Roughly 11 years ago, I began investing in US equities based on a simple premise. Buying high-quality companies with better free cash flow yields and faster growth prospects than the benchmark, will generate better returns over the long term than the index. A decade into it, while our investee companies are performing reasonably well, to my surprise and disappointment, we find the strategy’s performance well behind the S&P 500.
The interesting thing is that the strategy hasn’t done poorly – it did as well as I expected it to do based on the investments that were made. The companies bought have delivered free cash flow yields well above the S&P 500. These cash flows usually grow faster thanks to organic growth and smart capital allocation, often including value-accretive buybacks. But you would have been better off just buying one of the low-cost ETFs that would have exposed you to the S&P 500.
Chances are you, if you are reading this, are either a professional investor or, at the very least, have done some investing on your own. If you made your own investment decisions, more likely than not, you are feeling one of two things right now:
- If you are one of the rare investors to have beaten the benchmark: “Ha! I am better than him.”
- If you haven’t: “See, there are other people like me.”
The purpose of this letter is not to make either one of the above categories feel better about themselves but to make me a better investor. The late Daniel Kahneman was famous for looking forward to being proven wrong since it allowed him to improve. I hope a critical review of past actions will help me make better investment decisions in the future … and if I make anyone feel better in the process – that’s a bonus!
Summary of Results
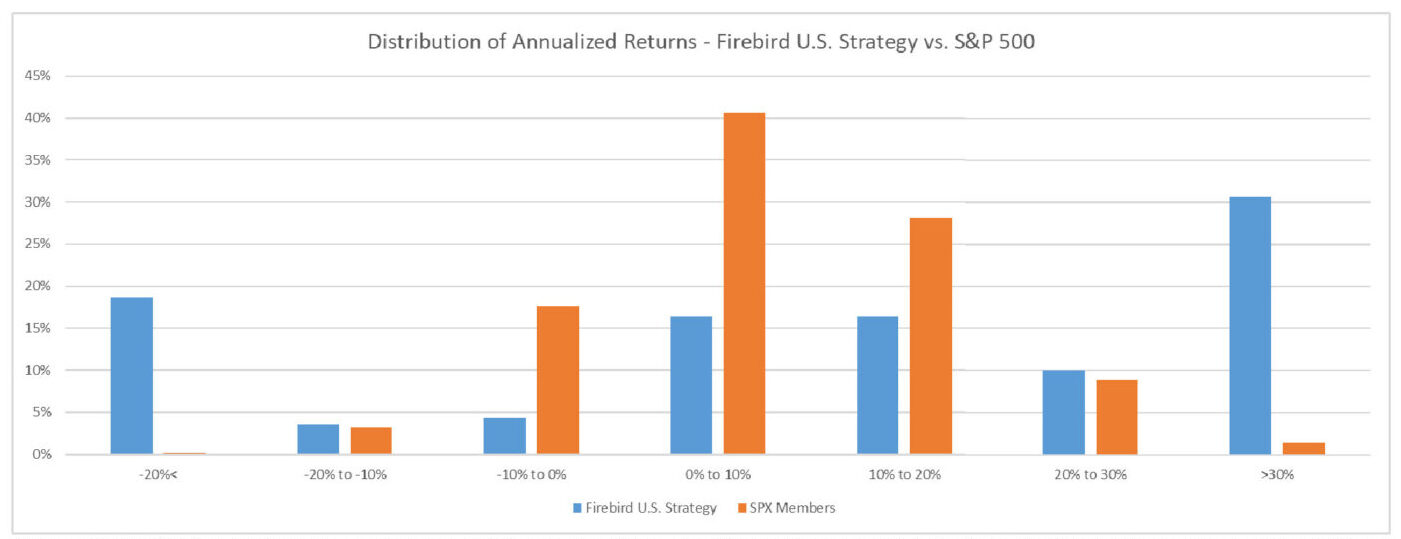
Since the I began investing using this strategy in 2012 through 2023, there have been 135 decisions to add a company to the portfolio. The results from these investments were anything but ordinary, with nearly 50% of purchases delivering IRRs of either above 30% or below -20%. By comparison, for the S&P 500, less than 2% of the companies in the index during this period delivered these types of returns. If the point of active management is to produce distinctive returns – we succeeded on that metric.
 Source: Firebird Value Advisors internal research; Information about specific past investments is included for illustrative purposes only and is not intended to be indicative of actual future investments or performance results that will be achieved by any fund or strategy. The actual net return of the strategy will be provided upon request. Past performance may not be indicative of future results, and the results of actual investments may differ significantly.
It is hard to come up with one reason why the dispersion of returns in our investments is so different from the benchmark, but one explanation could be time intervals. For the benchmark, we looked at the ten-year performance of all companies in the S&P 500 over the last decade. For our investments, we consider actual IRRs achieved over a holding period ranging from four months to ten years, with an average of about two and a half years.
While winning investments will be analyzed later on, we will first review the investments that have delivered IRRs of 10% or less over our holding period. In the portfolio, investments are placed into one of the following categories:
- Cash Flow Growth at Reasonable Prices – Companies that are growing revenues and profits at an annual rate of 5% or more while trading at a price that we consider to be attractive for that level of growth
- Growth with Temporary Problems – Companies that have the potential to grow annual revenues and profits at a rate of 10% or more but, for one reason or another, are dealing with a temporary setback
- Value with a Moat – Companies operating in industries with natural growth rate of 5% or lower but allocating capital in a value-added manner and trading at a very attractive price
Usually, the portfolio is more or less equally split between these categories, but more than half of the investments that failed to beat the benchmark came from the Value with a Moat category.
Is Value with a Moat still a viable strategy?
Given these results, it is tempting to dismiss the whole Value with a Moat category as “uninvestable,” but that would be succumbing to recency bias given that value companies have usually outperformed the market over long periods but haven’t done so in the last five years. We had several successful investments in this category, including Owens Corning, FMC Technip, and Ameriprise Financial. The common theme amongst those “winners” is that they are high-quality, well-run companies gaining share in stable industries. The combination of these factors leads to expanding margins and, in turn, strong market performance. That said, there have also been a fair share of less successful outcomes.
We looked at the companies purchased since the inception of the strategy that fell into this segment and assigned them further attributes such as High Leverage, Declining Addressable Market, Declining Margins, etc. While each of these measures impacted performance, one characteristic, the declining addressable market, seems to be overwhelmingly to blame for many of our poor decisions over the years. The takeaway is: Don’t buy companies with shrinking addressable markets.
A solid counterargument can be made by people investing in high-quality companies with a shrinking consumer base, such as tobacco. Still, one should know what they are good at and where the decisions usually prove faulty. It turns out I am not a good “cigar butt” investor.
When to Sell?
The median holding period for investments in the strategy is just under two years, which aligns with our expected two- to three-year goal. Over the last eleven years, we sold 109 companies, out of which 59 were sold due to a change in thesis and 42 because we felt they were too expensive and that better returns were available in other investments. The remaining 8 were taken over. The companies sold due to the change of thesis delivered negative returns on average, proving that these decisions were usually correct. However, the companies sold because they were too expensive turned out, more often than not… not.
These 42 companies compounded on average over 12% per annum after our sale. They included United Rentals, Microsoft, Apple, and Progressive – all of which delivered 20%+ IRRs for years after our sale. The takeaway is: Once you have a company where the thesis works, it pays to hold onto it for much longer than initially thought. But for how long?
The question of when to sell a successful investment has been confounding investors for as long as financial markets have been around. Even the greatest long-term investments, like Microsoft or Coca-Cola, had decade-plus periods in which total shareholder returns was negative or zero. In the most recent example of the deliberation on the topic, Berkshire Hathaway showed, by selling down their Apple position, that there is a limit to what proportion of their portfolio they are willing to deploy in a high-quality company where price has gotten ahead of the fundamentals.
Chart: Microsoft Share Price 1990-2024.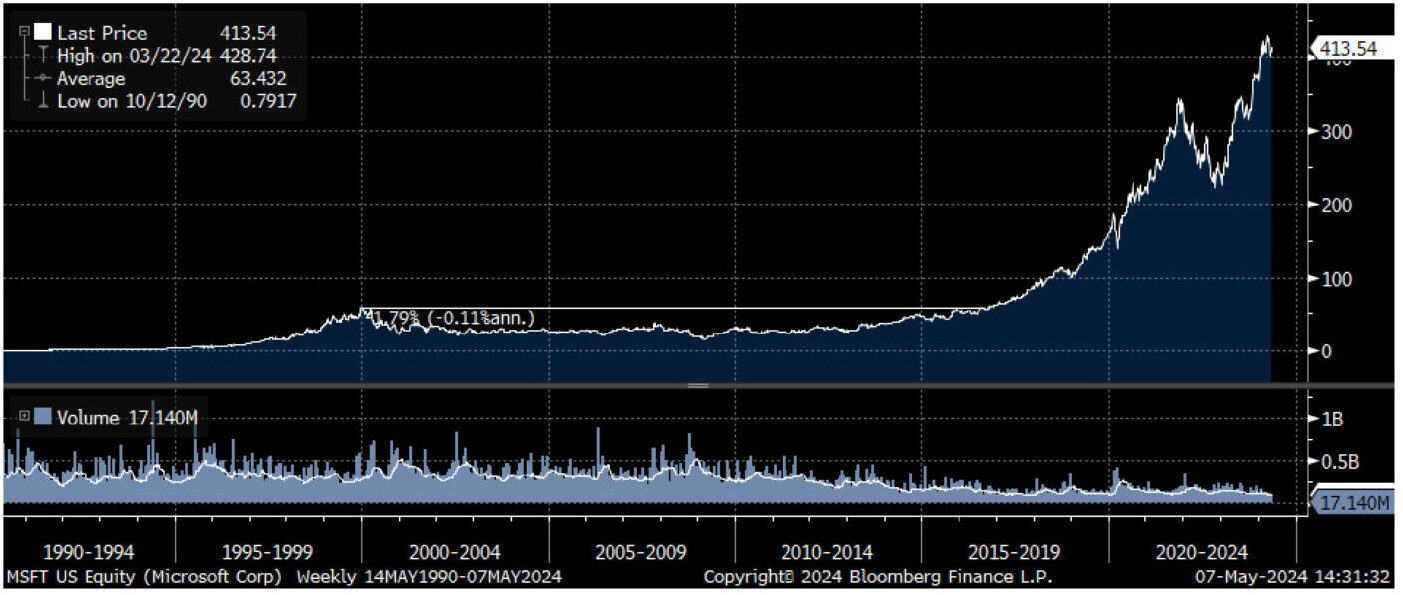
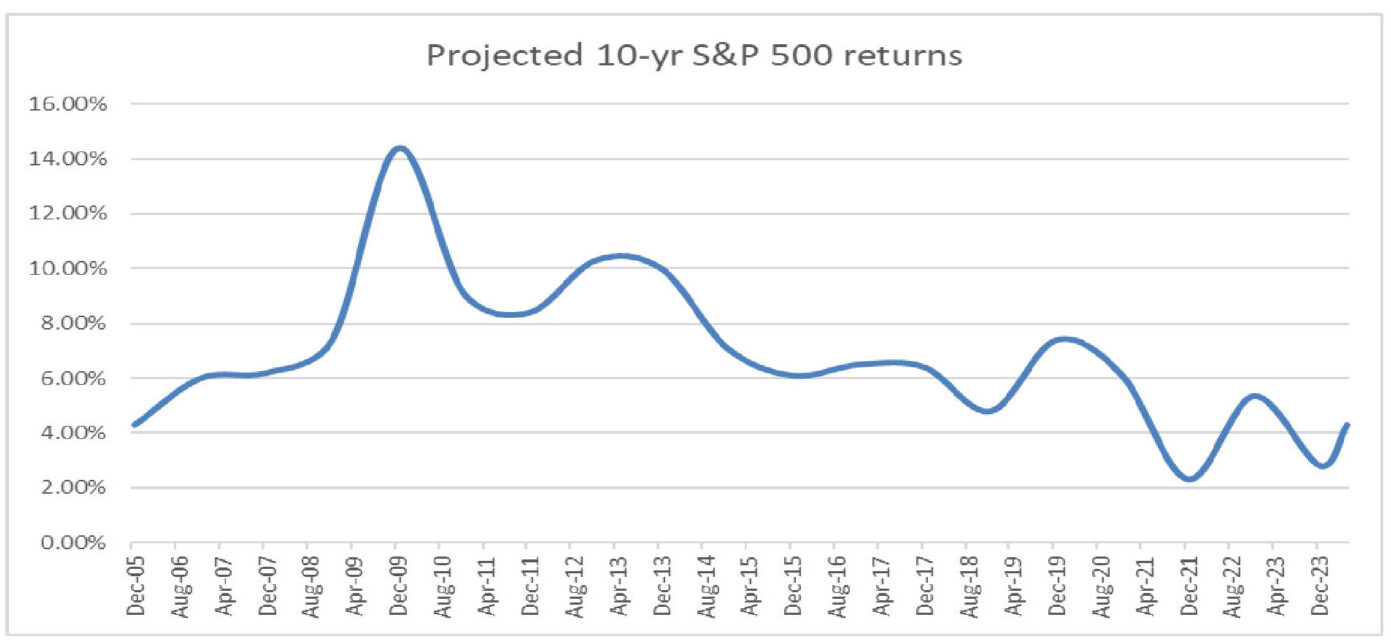
Our investment process is centered around a rate of return that investors can expect to earn from a particular company over a decade, assuming a certain revenue growth rate, free cash flow generation, and a multiple on an exit based on historical trading ranges. We’ve generated models on over 700 companies that predict a rate of return that we use as a screening tool in our investment process. We also have a model that does a similar calculation for the S&P 500 index, which currently predicts roughly a 4.3% annualized rate of return from a passive investment in the benchmark.
 Source: Firebird Value Advisors internal research
In the past, a successful investment would be sold when the expected return, based on our reasonable assumptions, fell below that of the overall portfolio and the new investments considered. Given the excellent returns that many of these investments generated after our sale, that timing discipline has proven to have been too early and can be improved. In the future, we will consider using the expected return of the S&P as the hurdle rate for the sale of successful investments, hopefully preventing us from selling way too early and improving results over time.
Continue to Hold Underperformers or Time to Divest?
The next question is whether to hold onto investments that are not working out based on the initial thesis. Out of 135 companies, roughly half at some point traded at least 20% below our entry price, but many of them have come back and contributed to the portfolio’s performance. The average performance of these investments since the 20% drop is varied, but on balance these companies have added to the portfolio’s performance, most beating the benchmark between the day of the drop and eventual sale.
The takeaway is: It is okay to hold on to companies where the shares are underperforming, but it is imperative to reconfirm the thesis.
So, What Performed Best?
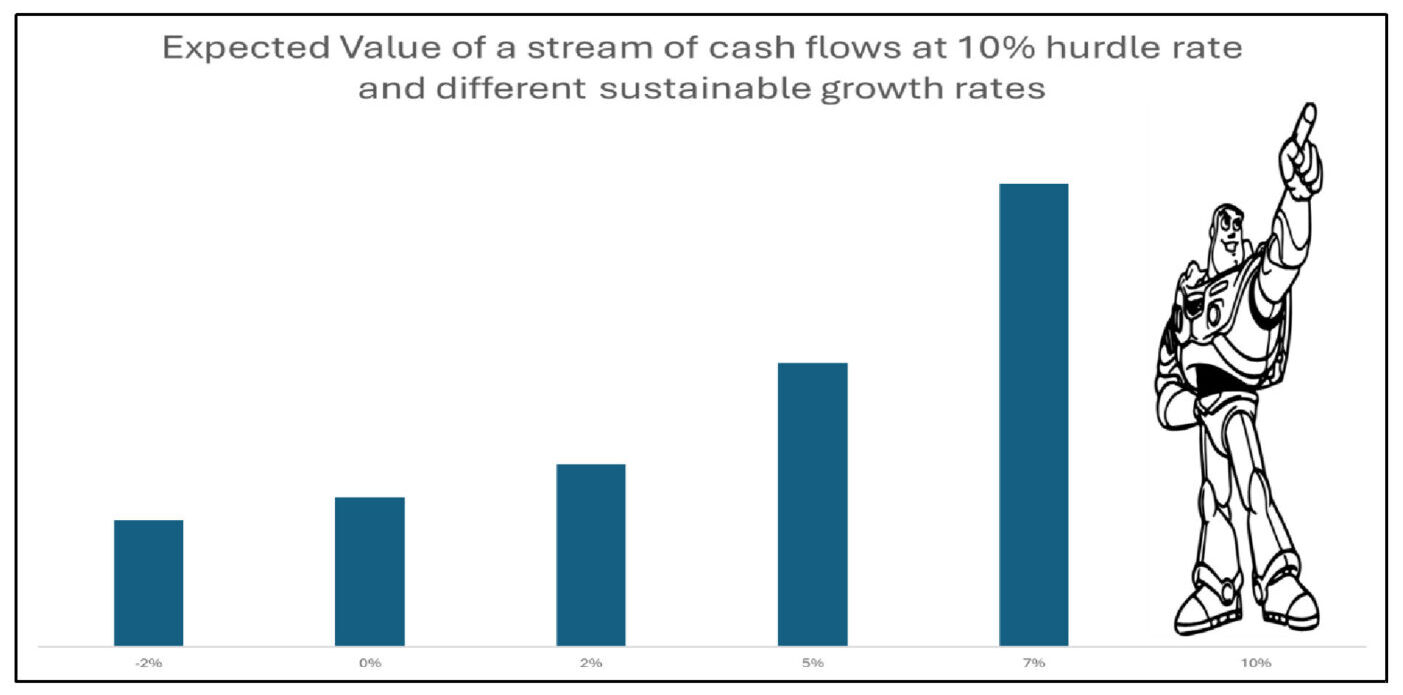
Now for the good news – nearly 1/3 of all investment decisions made resulted in IRRs of 30%+ with an average holding period of 600 days. By analyzing these 40 or so investments, accelerating growth was often noted as the reason for outstanding performance. To make it into this category, the company doesn’t need to be fast-growing; it’s growth just has to be higher than it’s most recent results in order to generate multiple expansion that usually accompanies these situations. The mathematical reason for the expanding multiple is in the Terminal Value, which grows exponentially with a higher assumed normalized growth rate.
Finding this type of opportunity is easier said than done, but we feel comfortable that we will be able to uncover enough of them over time. Currently, there are several companies with these attributes in the portfolio.
The takeaway is: Look for companies with an inflection point that will accelerate growth and expand margins.
Last but not least, the only reason I had the opportunity to learn from investment decisions for over ten years is the unwavering support of amazing investors who had confidence in us from the beginning. They include business owners and fund managers who are innately attracted to our cash flow focused approach and often serve as an experienced sounding board. I am humbled to have their trust.
In reflection, the journey of managing this strategy over the past decade has been filled with valuable lessons, each contributing to a deeper understanding of the investment process. As I scrutinize past decisions and outcomes, it becomes evident that success in the investment landscape is not solely determined by the quality of companies we invest in but also by the timing of the actions, sticking to our circle of competence, and my ability to adapt.
I am excited to see what the next ten years will bring.
Lessons –
- Keep winners longer. Don’t sell them just because they are up
- Don’t buy companies with a shrinking addressable market
- It is okay to hold on to companies that have traded down since the purchase, but be realistic
- Look for companies with accelerating growth and expanding margins
- Have the right investors
“We have a passion for keeping things simple.”— Charlie Munger
This document shall not constitute an offer to sell or a solicitation of an offer to purchase any interest in any fund or other investment. Any such offer shall only be made pursuant to the private placement memorandum and other offering materials for the relevant fund. Any prospective investor should review the private placement memorandum carefully for more detailed information about the risks, fees, expenses and other terms of investing in each fund, and consult with the investor’s own tax, financial, legal and other professional advisors. Information about specific past investments is included for illustrative purposes only and is not intended to be indicative of actual future investments or performance results that will be achieved by any fund or strategy. The actual net return of the strategy will be provided upon request. Past performance may not be indicative of future results, and the results of actual investments may differ significantly.
Members, log in below to access the restricted content.
Not a member?
Thank you for your interest. Please note that MOI Global is closed to new members at this time. If you would like to join the waiting list, complete the following form:
About The Author: Steve Gorelik
Steve Gorelik is the Fund Manager of Firebird U.S. Value Fund as well as portfolio manager of Firebird’s Eastern Europe and Russia Funds. He joined Firebird in 2005 from Columbia University Graduate School of Business while completing education from a highly selective Value Investing Program. Prior to business school, Steve was an operational strategy consultant at Deloitte working with companies in various industries including banking, healthcare, and retail. He holds a BS degree from Carnegie Mellon University as well as a CFA (chartered financial analyst) charter and a membership in Beta Gamma Sigma honor society. Steve serves on the boards of Teliani Valley (Georgia), Arco Vara (Estonia), and Pharmsynthez (Russia). He speaks Russian, English and his native Belarussian.
More posts by Steve Gorelik