This post by Phil Ordway has been excerpted from a letter of Anabatic Investment Partners.
I have continued to find a number of attractive opportunities in community banks. The rally in late 2016 has abated – albeit with most equities priced higher than they were a year ago – but the underlying fundamentals and the acquisition environment remain favorable. First quarter loan demand was actually weaker than expected, but greater efficiency and exceptionally strong balance sheets left many banks in an excellent position.
Bank acquisitions have continued at a brisk pace in 2017. The 2016 rally lead some to believe that M&A would slow due to higher prices and uncertainty about regulation and tax policy, among other factors. But buyers now have more valuable currency in their own shares and the deals announced in 2017 have seen very little change in the amount of tangible book value dilution or the associated earnback period as compared to deals announced in the first half of 2016. Barring a second half slowdown in announced transactions, this will likely be one of the most active years for M&A since the financial crisis.
As noted in the last letter, Anchor Bancorp (ANBC) has agreed to be acquired by Washington Federal (WAFD) in an all-stock deal that is expected to close later this year. WAFD is an efficient bank headquartered in Seattle that should be able to make much better use of ANCB’s balance sheet.[1]
OceanFirst (OCFC) completed its acquisition of OSHC in November 2016 and the first quarter of 2017 provided an encouraging initial look at the progress the combined entity has made.[2] The integration was completed in May, and in June OCFC reported that all the expected cost savings had been achieved.
OCFC didn’t waste any time after it completed the integration of OSHC. On June 30, OCFC announced its acquisition of Sun Bancorp, Inc. (SNBC), a local competitor in New Jersey with $2.3 billion in assets. While the timing may have been a little surprising, coming on the heels of two other large deals in 2016, the combination itself was not. Tom O’Brien, CEO of SNBC has led a successful transformation of that bank, and Chris Maher has been an admirer from afar for at least a few years. There is a shared culture of efficiency and prudent lending, and the considerable geographic overlap should enable significant cost savings to be realized.
The deal itself is attractive. OCFC paid $487 million – essentially no premium to the market price before the deal was announced – using a mix of cash (15%) and OCFC shares (85%). The dilution to OCFC’s tangible book value per share is minimal at 1.2% and the earnback period is just 3 ½ years. The deal values SNBC at less than 1.6 times its 3/31/17 tangible book value (adjusted for SNBC’s tax asset) and approximately 14-15 times forward earnings, assuming OCFC can deliver the promised cost savings. The core deposit premium of 12.7% is reasonable given SNBC’s attractive deposit franchise that reported a recent cost of deposits of 0.39%. SNBC also brings approximately $100 million of excess equity capital to the combined company, taking the pro-forma TCE ratio near 9%.
At roughly $7.5 billion in assets, the combined company will have core deposits of more than $5 billion and a pro forma cost of deposits of roughly 0.30%. It should be able to achieve an ROA of at least 1.15-1.20%, a return on tangible common equity of at least 13%, and an efficiency ratio approaching 50%. Using fiscal 2016 data, that would make OCFC among the 20 most efficient community banks in the country.
The acquisition of SNBC should make OCFC a stronger, more profitable bank and I still think that the future looks bright. That said, the integration risk in this deal is material, despite OCFC’s nearly flawless integration of CBNJ and OSHC. OCFC has grown by leaps and bounds in the past three years and such growth often comes with speed bumps along the way. The deal is expected to close in early 1Q18, so this transaction also pushes off the chance of a sale of OCFC until at least mid-2018. It is worth noting, however, that if a sale ever occurs the acquisition of SNBC – if executed successfully – will make OCFC a much more valuable target for larger banks.[3]
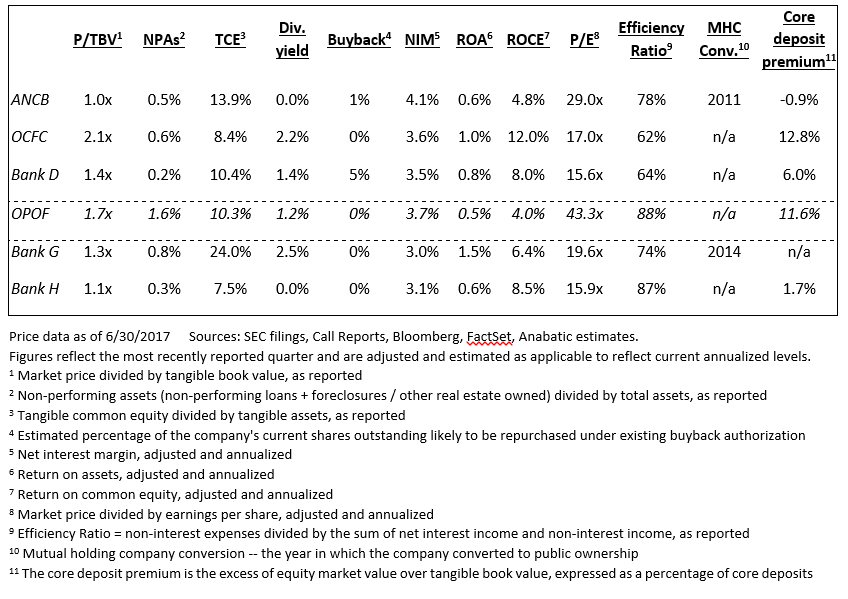
The following table reflects our holdings in community banks as of June 30, 2017. During the second quarter there was a fair amount of portfolio activity:
- We continued to slowly sell our holding in Bank D as it approached my estimate of full value. It is worth noting that the price has edged down in recent weeks, and our future sales (or purchases) will continue to be made based on the tradeoff between the risks and rewards that are discounted in the price.
- In April we sold our last shares in Old Point Financial (OPOF), previously shown as Bank F. (It is shown below for reference only – we no longer own any shares.). I began buying OPOF in the summer of 2016 based on an improving earning profile, a low-cost deposit base, burgeoning acquisition interest in the area, and an attractive price. OPOF is a small bank – the market cap was under $100 million at the time of our initial purchases – and I made the mistake of not buy aggressively enough. Our average cost of $19.42 was attractive, but as the price began creeping up over the next few months I did not add to it as much as I could have, and our position never exceeded 2% of capital.
By February and March of this year, OPOF was approaching $30 per share and I began to sell. At that price, OPOF was trading at more than 1.5 times tangible book value, at a sky-high multiple of earnings, and at a 10-11% core deposit premium.[4] The company was not over-capitalized but the ROE was stuck in the mid-single digits with an efficiency ratio well above 80%. In other words, OPOF was already pricing in an acquisition and/or a rapid acceleration in earnings. The company has also expanded into ancillary businesses, made a change at CFO, and seen a small uptick in problem credits. OPOF’s earnings may yet accelerate and an acquisition could materialize – for whatever reason, the stock has continued to climb in recent months – but at this price, I believe our capital is best deployed in other opportunities.
- Bank G was a new addition to the portfolio in the first quarter of 2017. It passed the third anniversary of its demutualization in January and I believe its earnings and acquisition prospects are promising.
- Bank H is a new investment as of the second quarter. This bank has successfully navigated a boom-and-bust local economy, producing excellent credit results and good profits along the way. The bank also has a large, low-cost deposit base that would be extremely valuable to an acquirer and I think a sale of the company is reasonably likely in the next year or so.
We did not buy or sell any Wells Fargo TARP warrants during the quarter. The company continues to plod along following the “sales practice scandal” that mushroomed in 2016. I still believe that the long-term impact on the company’s deposit and economic franchise will be minimal, although the overall implications of this scandal cannot be ignored. With just over a year before the expiration of our warrants I have begun weighing the option of holding shares in WFC outright or selling our warrants before they expire. At this point I have decided that the warrants remain a worthwhile investment, but should a better idea come along this would be among the first to go.[5]
[1] Despite a healthy net interest margin ANCB had never managed to achieve the right mix of scale and costs to make a reasonable amount of money. ANCB’s efficiency ratio – a measure of a bank’s profitability that is analogous to the inverse of an operating profit margin for most companies – was over 90% in each of the past three fiscal years, and despite some recent improvements there was little hope of getting below 75%, let alone into the 60% range that would be competitive. WAFC, while far bigger, has had an efficiency ratio near or below 50% in recent years.
[2] As discussed in prior letters, during 2015 we made investments in CBNJ and OSHC, both of which have since been acquired by OCFC. The shares of OCFC we own today were received as compensation in those deals.
[3] As an aside, SNBC was 22% owned by Wilbur Ross. His new role as Commerce Secretary and subsequent divestiture of direct ownership may or may not have played a role in the timing of the transaction, but there will be approximately 3.3 million shares held for his benefit that may well hit the market after the deal closes. I think it is difficult to predict what impact, if any, such sales may have on the short-term market price, but in any case we’ll weigh our options based on the economic merits of the investment.
[4] I’ve added a column to the table above to highlight this issue.
[5] Please refer to our 4Q16 letter which described, among other aspects, WFC’s deposit franchise. “Since 1966, Wells has seen core deposits decline on an annual basis just seven times (and in some of those cases the company was intentionally running off deposits). Over five decades, WFC’s core deposits have grown at a compounded rate of more than 12% per year. In ‘bad’ years for the economy or the stock market WFC’s core deposits still grew: +8% in 1973, +16% in 2001, +7% in 2008. Even in the slow-growth recovery of 2010-2016 the company’s core deposits have grown at 7% per year. And the average cost of deposits was 0.12% as of 4Q16.”
IMPORTANT NOTE
Gross Long and Gross Short performance attribution for the month and year-to-date periods is based on internal calculations of gross trading profits and losses (net of trading costs), excluding management fees/incentive allocation, borrowing costs or other fund expenses. Net Return for the month is based on the determination of the fund’s third-party administrator of month-end net asset value for the referenced time period, and is net of all such management fees/incentive allocation, borrowing costs and other fund expenses. Net Return presented above for periods longer than one month represents the geometric average of the monthly net returns during the applicable period, including the Net Return for the month referenced herein. An investor’s individual Net Return for the referenced time period(s) may differ based upon, among other things, date of investment. In the event of any discrepancy between the Net Return contained herein and the information on an investor’s monthly account statement, the information contained in such monthly account statement shall govern. All such calculations are unaudited and subject to further review and change.
For purposes of the foregoing, the calculation of Exposure Value includes: (i) for equities, market value, and (ii) for equity options, delta-adjusted notional value.
THE INFORMATION PROVIDED HEREIN IS CONFIDENTIAL AND PROPRIETARY AND IS, AND WILL REMAIN AT ALL TIMES, THE PROPERTY OF ANABATIC INVESTMENT PARTNERS LLC, AS INVESTMENT MANAGER, AND/OR ITS AFFILIATES. THE INFORMATION IS BEING PROVIDED SOLELY TO THE RECIPIENT IN ITS CAPACITY AS AN INVESTOR IN THE FUNDS OR PRODUCTS REFERENCED HEREIN AND FOR INFORMATIONAL PURPOSES ONLY.
THE INFORMATION HEREIN IS NOT INTENDED TO BE A COMPLETE PERFORMANCE PRESENTATION OR ANALYSIS AND IS SUBJECT TO CHANGE. NONE OF ANABATIC INVESTMENT PARTNERS LLC, AS INVESTMENT MANAGER, THE FUNDS OR PRODUCTS REFERRED TO HEREIN OR ANY AFFILIATE, MANAGER, MEMBER, OFFICER, EMPLOYEE OR AGENT OR REPRESENTATIVE THEREOF MAKES ANY REPRESENTATION OR WARRANTY WITH RESPECT TO THE INFORMATION PROVIDED HEREIN. AN INVESTMENT IN ANY FUND OR PRODUCT REFERRED TO HEREIN IS SPECULATIVE AND INVOLVES A HIGH DEGREE OF RISK. THERE CAN BE NO ASSURANCE THAT THE INVESTMENT OBJECTIVE OF ANY SUCH FUND OR PRODUCT WILL BE ACHIEVED. MOREOVER, PAST PERFORMANCE SHOULD NOT BE CONSTRUED AS A GUARANTEE OR AN INDICATOR OF THE FUTURE PERFORMANCE OF ANY FUND OR PRODUCT. AN INVESTMENT IN ANY FUND OR PRODUCT REFERRED TO HEREIN CAN LOSE VALUE. INVESTORS SHOULD CONSULT THEIR OWN PROFESSIONAL ADVISORS AS TO LEGAL, TAX AND OTHER MATTERS RELATING TO AN INVESTMENT IN ANY FUND OR PRODUCT.
THIS IS NOT AN OFFER TO SELL OR SOLICITATION OF AN OFFER TO BUY AN INTEREST IN A FUND OR PRODUCT. ANY SUCH OFFER OR SOLICITATION WILL BE MADE ONLY BY MEANS OF DELIVERY OF A FINAL OFFERING MEMORANDUM, PROSPECTUS OR CIRCULAR RELATING TO SUCH FUND AND ONLY TO QUALIFIED INVESTORS IN THOSE JURISDICTIONS WHERE PERMITTED BY LAW.
ALL FUND OR PRODUCT PERFORMANCE, ATTRIBUTION AND EXPOSURE DATA, STATISTICS, METRICS OR RELATED INFORMATION REFERENCED HEREIN IS ESTIMATED AND APPROXIMATED. SUCH INFORMATION IS LIMITED AND UNAUDITED AND, ACCORDINGLY, DOES NOT PURPORT, NOR IS IT INTENDED, TO BE INDICATIVE OR A PREDICTOR OF ANY SUCH MEASURES IN ANY FUTURE PERIOD AND/OR UNDER DIFFERENT MARKET CONDITIONS. AS A RESULT, THE COMPOSITION, SIZE OF, AND RISKS INHERENT IN AN INVESTMENT IN A FUND OR PRODUCT REFERRED TO HEREIN MAY DIFFER SUBSTANTIALLY FROM THE INFORMATION SET FORTH, OR IMPLIED, HEREIN.
PERFORMANCE DATA IS PRESENTED NET OF APPLICABLE MANAGEMENT FEES AND INCENTIVE FEES/ALLOCATION AND EXPENSES, EXCEPT FOR ATTRIBUTION DATA, TO THE EXTENT REFERENCED HEREIN, OR AS MAY BE OTHERWISE NOTED HEREIN. NET RETURNS, WHERE PRESENTED HEREIN, ASSUME AN INVESTMENT IN THE APPLICABLE FUND OR PRODUCT FOR THE ENTIRE PERIOD REFERENCED. AN INVESTOR’S INDIVIDUAL PERFORMANCE WILL DIFFER BASED UPON, AMONG OTHER THINGS, THE FUND OR PRODUCT IN WHICH SUCH INVESTMENT IS MADE, THE INVESTOR’S “NEW ISSUE” ELIGIBILITY (IF APPLICABLE), AND DATE OF INVESTMENT. IN THE EVENT OF ANY DISCREPANCY BETWEEN THE INFORMATION CONTAINED HEREIN AND THE INFORMATION IN AN INVESTOR’S MONTHLY ACCOUNT STATEMENT IN RESPECT OF THE INVESTOR’S INVESTMENT IN A FUND OR PRODUCT REFERRED TO HEREIN, THE INFORMATION CONTAINED IN THE INVESTOR’S MONTHLY ACCOUNT STATEMENT SHALL GOVERN.
NOTE ON INDEX PERFORMANCE
INDEX PERFORMANCE DATA AND RELATED METRICS, TO THE EXTENT REFERENCED HEREIN, ARE PROVIDED FOR COMPARISON PURPOSES ONLY AND ARE BASED ON (OR DERIVED FROM) DATA PUBLISHED OR PROVIDED BY EXTERNAL SOURCES. THE INDICES, THEIR COMPOSITION AND RELATED DATA GENERALLY ARE OWNED BY AND ARE PROPRIETARY TO THE COMPILER OR PUBLISHER THEREOF. THE SOURCE OF AND AVAILABLE ADDITIONAL INFORMATION REGARDING ANY SUCH INDEX DATA IS AVAILABLE UPON REQUEST.
About The Author: Philip Ordway
Philip Ordway is Principal and Portfolio Manager of Anabatic Fund, L.P. Previously, Philip was a partner at Chicago Fundamental Investment Partners (CFIP). At CFIP, which he joined in 2007, Philip was responsible for investments across the capital structure in various industries. Prior to joining Chicago Fundamental Investment Partners, Philip was an analyst in structured corporate finance with Citigroup Global Markets, Inc. from 2002 to 2005, where he was part of a team responsible for identifying financing solutions for companies initially in the global power and utilities group and ultimately in the global autos and industrials group. Philip earned his M.B.A. from the Kellogg School of Management at Northwestern University in 2007 and his B.S. in Education & Social Policy and Economics from Northwestern University in 2002.
More posts by Philip Ordway