The following transcript of the Peterson Capital Management annual meeting, held in August 2017, has been provided by MOI Global instructor Matthew Peterson, managing partner of Peterson Capital Management. Matthew is an instructor at Best Ideas 2018, the fully online conference featuring more than one hundred expert instructors from the MOI Global membership community.
I’d like to welcome you to the first Peterson Capital Management Annual Meeting. We had to compete with the solar eclipse, and some significant traffic and parking, so I’m really happy you are all here. I’m going to start with a few housekeeping items before we kick into things.
The meeting here is going to go until about 4:30pm. We’re then going to head outside. I’m going to walk out to the dinner venue, we’re hosting a dinner a Pancho’s. If you’re able to make it, we’d love for you to be there. You’re welcome to walk, drive, ride share. It’s a little more than a mile, it’s a beautiful walk. For those of you who still haven’t had enough, tomorrow we’ve committed to going out on a deep sea fishing trip. I’m going to bring my children, my wife is coming, and if you’re interested we’d love to have you there. That’s a cash trip. I think for the license, equipment, and the event it’s about 75 dollars; they take cash on the boat.
So with that, again, I’d like to welcome you all here to the meeting. The plan here is, I’m going to go through a few slides, about a dozen slides. I want to get everybody on the same page. Some of you have been with us, following us, and been investors in the fund for many years. Some of you are newer to the fund. So we’ll get everybody on the same page for a minute, then we’re going to take a quick moment and I’m going to play a video; it’s a 14 minute video, it’s a wonderful video. During that time if you need some refreshments, or to use the facilities, I encourage you to do so. When the film is over, we’re going to go right into a Q & A. I want to get to the questions session, hopefully question and answer session, as quickly as possible, so we can talk about what’s on your minds.
I’m going to run through these [slides] pretty quickly here. [First, I will] give you a quick background on fund overview. It’s mostly fund performance. I’m going to talk high-level about how we think about building wealth, how I think that we should all consider building wealth, and then, talk to the practical application of creating alpha. Alpha is the managers added value to the fund.
We have a mission statement. Our mission is to provide a world-class capital allocation vehicle that builds enormous wealth for our long-term partners. We’re not thinking about three years, were not thinking about five years, were thinking about 10, 20, 30 years, and the wealth that we can create for our partners.
I moved here six years ago— for those of you not from Manhattan Beach, I know a few of you flew in from Salt Lake, San Francisco, New York, and it’s great to have everybody here. I moved here from New York six years ago, launched the fund, and we have done very well. Our annualized performance since conception is 14.16 percent, I don’t have to tell you how remarkable that is. It’s certainly world-class. We live in a world where we have zero percent interest rates, your cash at the bank [pays] next-to-nothing, ten-year bonds are paying two percent. So we are very pleased. Over the last 12 months we returned 29 percent. This is not linear, we don’t expect it to be linear. We will have years where we are down, and we will have years when we are up. Five years from now, I expect we’ll have another set of years, some where we are down, and some where we are up. But, for our long-term partners, we expect to be up significantly over the long term.
Let’s talk about the concept of wealth creation and building wealth. This is a slide that Warren Buffett used to show his early LP’s in the early 50’s and 60’s. I don’t think he called it a slide. This was the [content] on a piece of paper that he used to show them. This is meant to illustrate the power of compounding over the long term. There are two variables you can look at. It’s your rate of return and it’s the time you have. And we all have different amounts of time, but I was at a CFA conference in Seattle a couple years ago and I listened to a 75-year-old explain that his time horizon is 50 years. He has a certain amount that is allocated to his children and his grandchildren. He’s expecting to live for a while longer, and he’s expecting to give away money and help out future generations. So, at 75 he has 50 years remaining. I have young children, so I think I have a lot longer than that.
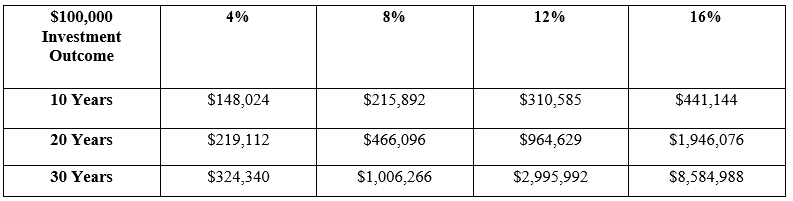
This is what Buffett used to show. If you’re able to obtain these types of interest rates, a $100,000 investment becomes very significant over time. If you’re at a 16 percent rate here, over 10 years, significantly, you’ll have $450,000. That would be a huge return on your investment. However, the incredible bit is that between years 10 and 30 it goes from $450,000 to $8.5 million. What most people don’t recognize is that the human mind doesn’t understand compounding intuitively. Everyone gets praised for being rational, logical, and thinking linearly. Nobody says, ‘oh, that’s a really scalable thought you just had.’ The fact of the matter is, people project in a linear manner what they anticipate the future rate of growth to be. It’s very hard to think exponentially.
I was going to surprise my assistant Parise here with a question and ask her if she could tell me what 7 x 4 is. And she’s good at math, I’m sure she could tell us that it’s 28. But, if you think about it as an example, what is 7 to the 4th [power], and you’d have to really think about it to come up with 2,401. So, the mind is not thinking exponentially, or scaleably. You have to focus, and really concentrate on understanding the potential. The potential is shown right here. It’s 10-years to 30-years [growing from] $450,000 to $8.5 million. I like to think about it in terms of 12 percent returns on 175,000, it’s just easy math in my mind. $175,000 at 12 percent over 30 years turns to $5 million. If you happen to have 50 years it grows to $50 million. So that is building significant wealth, enormous wealth.
Seth Klarman, an excellent, world-class investor, says the greatest single edge that an investor has is long-term orientation. I believe that to be very true.
So what does it require, what do you need to achieve those types of returns? You can evaluate your own period of time. What do you need to do to have great returns? I think there are three things that are essential to building wealth.
Number one, it’s imperative, its fundamental that you have a grasp of financial statements. You have to have your basic financial analysis internalized. That’s everything you learned in B-school, it’s everything you learned in [the] CFA program. It’s understanding that when you buy 10 percent of the stock from a business, you own 10 percent of that business. You’re buying the assets, you’re buying the liabilities, you’re buying that future return on equity. And, you need to think of stock ownership as ownership of the business and you need to understand the financial statements and everything associated with ownership of that business.
The second aspect here is financial theory. So the next level is, who’s winning the Nobel prize? What are they winning it for? Is the CAPM a good theory? Or, is it just a good theory in theory? At some points these theories break down. They’re really fun to teach, they’re really nice mathematically, but there are exceptions to these theories. The unique aspects where these theories break down is often where you can find ways to build wealth.
Then there’s the human side. I think the human side is the most underappreciated aspect of portfolio management. It is the psychology underlying the market participants, and it’s absolutely imperative to understand the psychology of the herd, and ideally to be working as a contrarian against that mentality.
So, just a few examples of this theory verses practice I just want to show you. This is basically the efficient market hypothesis. Markets are supposed to be efficient, objective and the asset prices are supposed to be right. That is the theory. Prices are correct. Everyone’s rational, everyone’s betting they’re own money. There’s enough market participants, the prices are supposed to be accurate. If its overpriced somebody would sell and the price would dip down. But, that’s not what happens in practice. In practice we see all the time that markets are made of emotional beings, and they swing like a pendulum too far, or too euphoric, and then too low, and too pessimistic.
Theoretically, you also see that people are risk adverse in theory, riskier assets should lead to a higher performing asset. But, in practice, the higher performing asset just has to have the perception of more risk, it doesn’t actually have more risk. Uncertainty, for example, would appear in some cases to be risky. However, if two [potential] outcomes are both positive, it might not necessarily be an riskier asset, just an uncertain asset and people often confuse uncertainty and risk.
Finally, this point at the bottom, I think that if you can really internalize this, it will help you immensely. Everybody knows the demand curve slopes [down] and to the right: you’re supposed to want more of a product at a lower price, and less of it at a higher price. But, in practice, in the markets, people warm to stocks as they go up, and they become more euphoric. And, the higher they go the more they want to buy. And when [stocks] go down, and they’re cheap, people panic and sell.
Everybody knows, buy low, sell high. Why do people so consistently do the opposite? It is such a mistake to be fearful when everyone’s fearful. When everybody’s fearful and the markets are low, try to be a buyer in that space. People treat stocks and a lot of financial products like Giffen goods, the exact opposite of the typical demand [curve]. So, as the price goes up, people buy more. And it’s simply economically wrong, but in practice that’s very much what happens.
Q: Can you explain what a Giffen good is?
A: A Giffen good [describes] a product where as the price increases, people demand more of it. There’s an old example about a potato famine in Ireland, where as the price of potatoes were increasing, people were buying more and more because they could no longer afford the substitute, beef. So as prices go up, you buy more. It’s rare to find those types of products, but financial products tend to operate like Giffen goods. And, it’s not how they should operate, it’s how the market participants think about the product, and they buy more as the price increases.
Q: What about Tulips?
A: Yes, well, there has been a lot of market mania, I can think of a few cryptocurrencies that have done that too.
I think the best way to conceptualize the market is as a pendulum. And I think one of the most important things that you can do as you’re making investments, is to gage where we are in the market cycle. There’s a business cycle, that is factual. We go into recessions, that is factual. We have euphoric periods, we have pessimistic periods. If you think about where the herd is in this swing of the pendulum, it will help you when you’re figuring out how to [invest] your capital. People swing from risk tolerant to risk averse all the time. I mean, in 2009, you couldn’t get people to put their money in the market while it was selling for a quarter of its intrinsic value. Today, people are different, people are more comfortable— it’s been eight years— people are much more comfortable with risk today than they were in 2009. That is a simple swing of this pendulum. I encourage people to think about the markets this way. It’s the easiest way to conceptualize the markets. So with that, what I’d like to do is talk a little bit about how we put this in to practice in our portfolio. I’ve been working on structuring a lot of this for decades, and what we have now is a concrete process.
We focus on process because process drives the outcome. If you constantly improve your process with a probabilistic [average] outcome of out-performance, you will, over the long term, be achieving out-performance. Each step in this process is an alpha created component, and I’m going to walk through them.
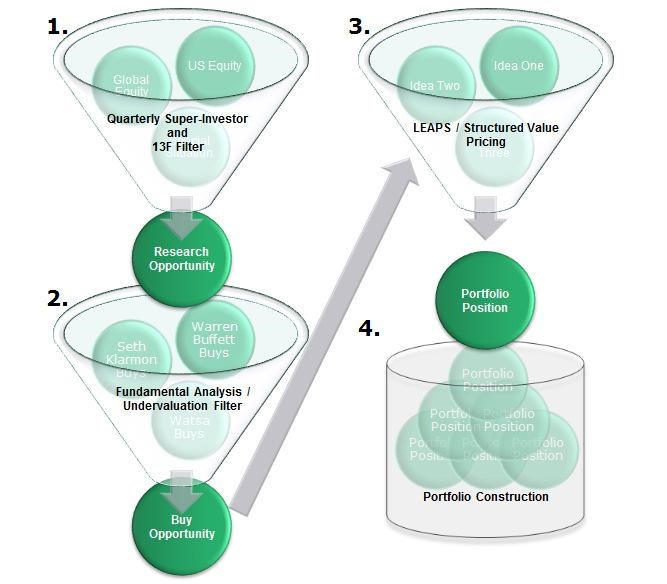
The first is the F13 analysis. That is, understanding what the super investors in the world are buying, and using that as your baseline of what you might start analyzing and looking [through].
Number two is fundamental analysis. Value investing itself is an alpha producing activity. The value investors of the world make up about 20 percent of active fund managers, and I would argue that many of them stray from their value mandate, so it’s actually quite rare to be value investing today. Fundamentally, as a value fund you are buying things for below their intrinsic value.
Then [third], we’re looking at leaps and structured products, and something I perfected while I was in New York. The fact is, you can combine products to allow you to have a better entry point. I buy the securities we build in the portfolio for below the prices in the New York Stock Exchange. I do not pay retail prices, I find ways to move into the securities for less than they would cost the typical investor in the market. Certainly an alpha adding step.
Then, finally, how do we objectively build out portfolio allocation in a concentrated manner such that it will give us the greatest returns over the long term? That’s the portfolio construction.
So, let’s look at these in detail. Every fund manager that manages over 125 million is required to publish publicly their holdings to the SEC every quarter. It’s remarkable. So you get Buffett, and you get Lou Simpson, and you get every great famous manager you know, who’s managing millions and billions, and who has analysts, support teams, and everybody else looking at the stock. Those that are concentrating their portfolios are taking huge amounts of money and placing huge bets on companies they know extremely well. There are 10,000 securities in the American public markets. We have a 15 position portfolio. If we are analyzing and looking for the .01 percent of companies that might be cheap enough to allocate the portfolio, we could look for years before we identify that via a needle in a haystack approach.
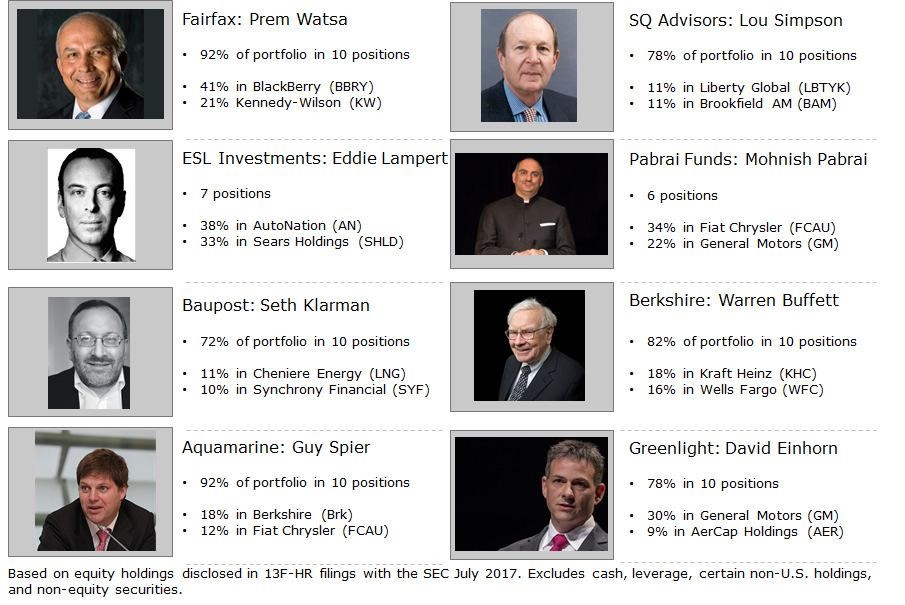
Using the 13Fs as a filter allows you to look at a few dozen managers, I look at 50-70 different managers. I look at what they are buying, what are they selling. When I can see that there’s a reason why they’re buying. An obvious discount to intrinsic value, it’s possible it might warrant a position in our portfolio.
This is a beautiful shortcut and you can do the same thing. You go to the Edgar SEC website, you look through your managers, and every quarter they’re going to put up their new buys and sells. There was actually a study done by a couple of professors a few years ago which really made me confident in this. All they analyzed was Berkshire Hathaway. They were looking for a way to outperform the S&P systematically because 80% of fund managers fail to outperform the S&P each year. And over the long term, that number comes way down. They were looking for a systematic approach to out performance and they decided to look at Berkshire.
Well, we know that Berkshire has out performed historically. We don’t quite know what happened in the future. [The professors] then said, why don’t we look at the 13Fs, and we buy what [Buffett] bought and sell what he sold and we do so not the day after its publicized, but three weeks later, at the end of the month, so there’s no time advantage. And what they found was that simply by copying the new positions and building a portfolio in that manner, they were outperforming the legacy holdings, and you could beat Berkshire Hathaway by 2 or 3 percent per year. So, through that simple approach I just extended our analysis over a larger range of incredible fund mangers and that allows us to narrow things down to a few hundred securities for analysis each quarter.
[Next is] financial statement analysis, I think we were pretty clear on that. Understanding the income statement, cash flow statement and balance sheet, and understanding if the company is under-valued. We are looking to buy a percentage of an undervalued business when we’re making asset allocation. We need to know why is the company mis-priced, we need to know the catalyst that’s going to bring it to full valuation, and we have a checklist to run through. Pilots have checklists, doctors have checklists. It’s surprising that more fund managers don’t have a checklist to make sure that they’re not overlooking common errors, or get tripped-up. The video that I’m going to show in a little bit is about human misjudgment. I think it is extremely applicable to investment fund managers and the management industry, and that’s what we’re trying to avoid with things like checklists.
Ok, step three. We only have four steps. Step three is our structured value [approach]. I will tell you, when I first launched the fund, I was nervous to share this with people. I thought we had such a proprietary model and it was so valuable. I used to have a home office, now I have a real office, and my wife would joke that we were printing money in the back room, because it was just so easy at certain times, more difficult at other times.
Structured value is basically using structured products, sometimes warrants, sometimes calls, sometimes puts, as a tool to move in to the security you want to own far below market prices. I’m going to give you a quick example about how advantageous this is, and also how irrational and mispriced this stuff can be.
This is a real example. This was in the portfolio in 2011, 2012, and 2013. In 2011, Warren Buffett announced that the company was so undervalued that they were going to take their cash, and instead of buying other businesses they were going to buy back their own stock. They were going to make it a company policy, they were going to buy back their shares at 1.2 times book value. The A share is famous because the A share is 250,000 dollars per share. The B share is 1/1,500 of an A share. At the time, 1.2 times book value was 80 dollars per share. So Buffett comes out and he announces across every financial journal we’re putting a company policy in place so anytime shares are below 1.2 we’re going to buy it back because it’s so undervalued. So obviously, efficient market hypothesis, the theory works. Prices automatically move to 80 dollars a share, no one is willing to sell for less. It is what you would expect, there is no arbitrage, in theory.
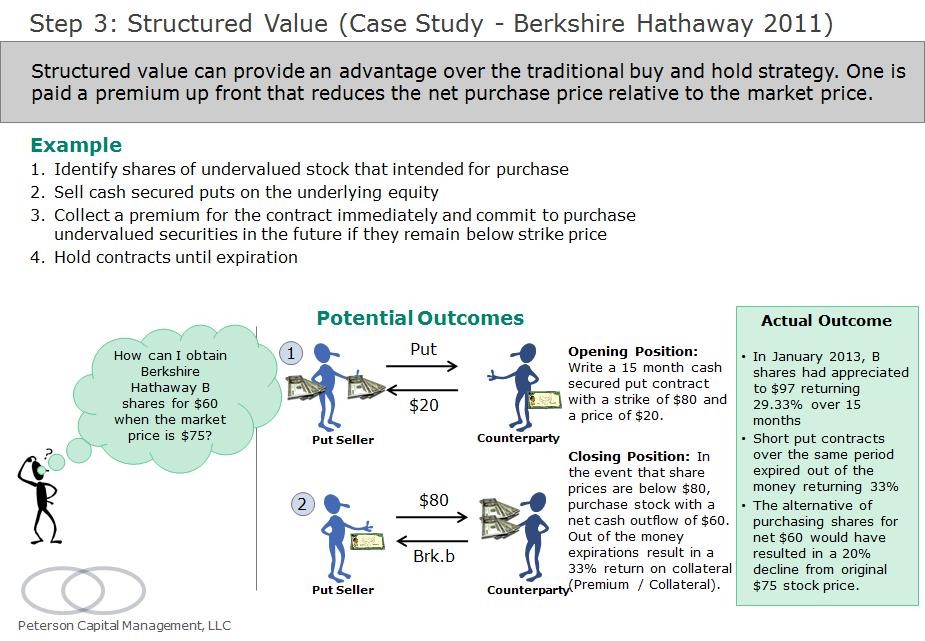
I went and looked at the Chicago Board Options Exchange. And, it was a few days later, it wasn’t the next day or the next minute, it was days later. I went to the CBOE and wrote a cash secured put. I was looking for a buyer who wanted to sell me their shares for $80 a share. We committed our cash to buy the stock for 80 dollars any time over the next 15 months. And they paid us 20 dollars for that commitment.
So think about what’s happening. Most people use these products in different ways. They use these products for short-term trading, they use these products in combination with another trade. We are literally using, these like a pork belly future where we actually want the pork belly.
We are taking these [puts] and insuring somebody else’s stock portfolio, and hoping that the price declines and they put their share to us. They have paid us 20 dollars per share to buy their stock for 80, and so we then hold 60 dollars in cash. We hold the 20 that they paid to us, and we wait for 15 months. We sit there, it’s like watching paint dry. The price goes up, the price goes down, we report returns to you guys. You’re like ‘what’s happening.’ I mean, not much. And at the end of the contract, 15 months later, there’s a binomial outcome. Either the price of the stock is above 80, in which the contracts finish and we keep the 20. We made 20 dollars on 60 over 15 months. We made 33 percent— we didn’t even own the stock. Or, in my view, the better situation is the prices declined. The price moves below 80, maybe it goes to 75, 70, the shares are put to us. Our counterpart thinks they’re lucky, they get to sell us the stock for 80. But, they paid us $20. So we now move in, we pay them the $80, and our net cash outflow is $60. Now Warren Buffett is telling the world that the stock is not fairly valued at $80, undervalued at $80. They’re willing to buy it up to $80 as a policy, we he’s gone, because its so undervalued. We have people paying us to buy their stock for the same price. So when we can take products like these, and use them to build our portfolio, we absolutely do our best to get the cheapest [entry] price possible.
Finally, step four is the Kelly Criterion. This Kelly Criterion is very unique and very important as you try to build out portfolios. I’m a member of a 10k club, and there are a few members here in the room. The 10k club is basically some very sophisticated fund managers and individuals in the Los Angeles area. We get together, maybe 10 times a year, and discuss important theories, sometimes company ideas, and opportunities, and it’s just a great group of minds sharing information.
One month, a few years ago, the subject was portfolio allocation, asset allocation. What do you do to determine what your asset allocation is to a particular new opportunity? And I was really interested in the subject because I didn’t think that I had the optimal answer. I thought there was too much subjectivity. Everyone went around the room, and shared their approach. And I was surprised because I heard everyone’s answer and everyone was having the same issue. There was subjectivity in all of the approaches. They’d find an idea, and they’d rank their confidence level on a scale of 1-10, and if they were extremely confident, maybe they’d put on 15 percent position. If they were not very confident, they would put on a two percent position. But they are determining their own confidence. And so, I continued to search for a more objective way, and what I came across was John Kelly.
John Kelly was originally working with Bell Labs, and he was tasked with the job of pushing a frequency through a telephone line. And, he found that optimal way to do it was essentially through this formula. That actually transferred very well in the betting markets, and they went to Las Vegas, and they won a lot of hands of blackjack. What the formula basically says is: if you know your probability of winning, and you know the outcome if you win, and you know the probability of losing, and you what you’re going to lose when you’re wrong, then you have exact objective answer on how much of your bankroll should be allocated to that particular single opportunity. That’s it. It has nothing to do with volatility, it has to do with maximizing your long-term growth rate.
The problem is, you think it would translate into the financial market as well, but all of those variables I just listed are subjective. I actually don’t know the probability of success. I think that it’s 100 percent, but I don’t know what the probability of a given opportunity is in terms of success. I also don’t know what the long-term gain is going to be as a result of that success, and I don’t know the probability of it being wrong, and I don’t know what the downside is if we are. And so, I tried to incorporate one of Charlie Munger’s theories/suggestions, which is: invert always invert.
I thought, if John Kelly was figuring this out in the 50’s and 60’s, he probably didn’t have a lot of computing power. And we do. And within about an hour, I went and looked at every probability. I said, let’s just calculate it for everything and see what happens. So I looked at possibilities from negative infinity to infinity and filled an excel sheet, and then I backed it in to some parameters and said let’s look at what’s realistic. And shockingly, what I found is that when you applied the Kelly criteria to a realistic set of parameters, and you calculate all the cells and probabilities, it basically says you should be allocating somewhere between 10 and 50 percent of your portfolio to every one of these ideas.
That means your portfolio should be made up of between 2 and 10 positions. Now, that is extremely concentrated. Currently we have 3 positions making up 70 percent of our portfolio. We have a 15 position portfolio, but [Kelly] is optimal. It won’t decrease volatility, but it will make the maximum performance available.
Statistically, if you start incorporating a 25th or 26th position into your portfolio, as, by the way, most mutual funds and many managers do, you are actually not decreasing the risk, or volatility. There is no longer an impact, you’ve all ready maximized your diversification. I like to say, now you’re “diworseifing” your portfolio.
And, what happens is, when you incorporate a 25th or 26th position in your portfolio, that position should not be expected to outperform one of the first, second, or third positions in your portfolio. So you’re incorporating a position that will have a lower return with a portfolio that’s all ready diversified completely. So, your basically incorporating a position that’s going to decrease your returns and not help you with your risk management.
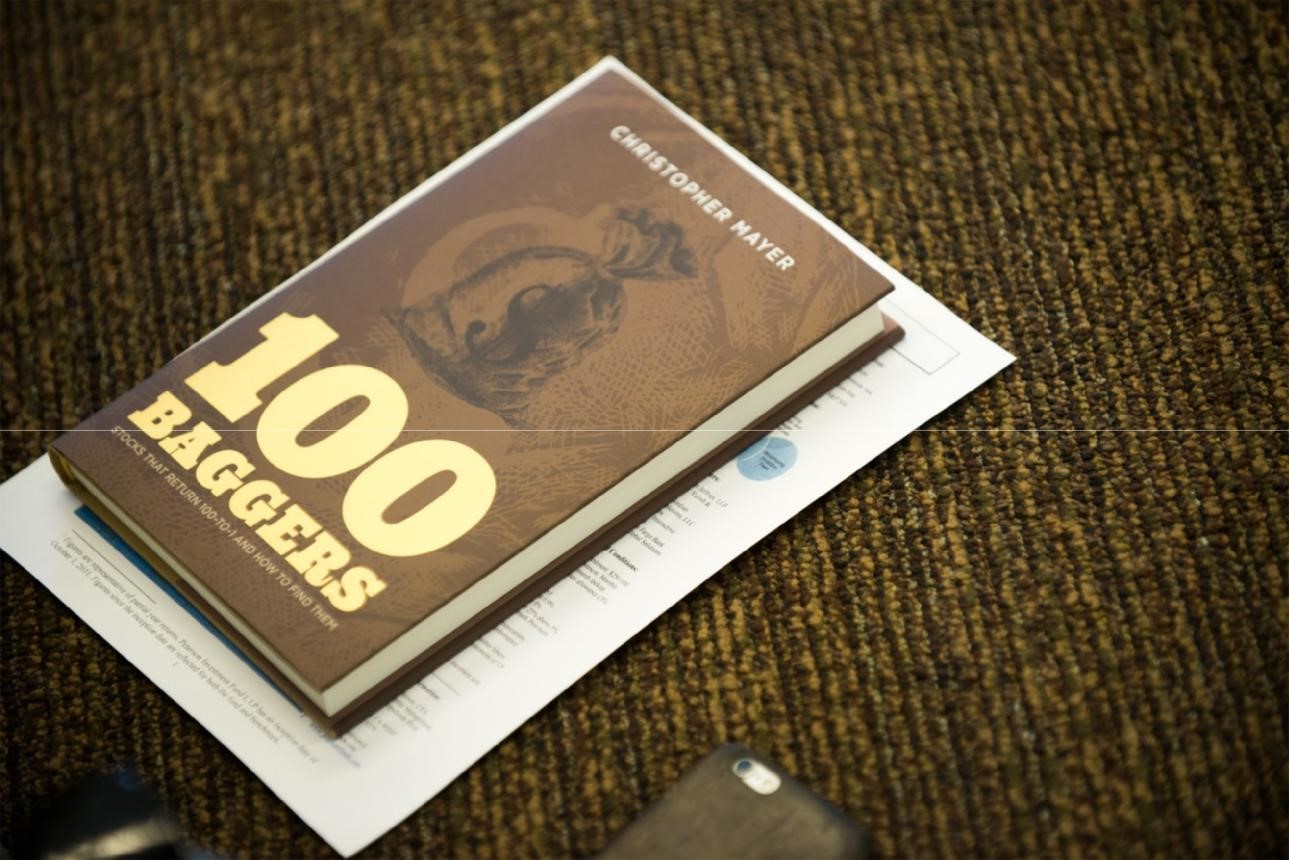
It is much more effective to have a very concentrated portfolio. Something along the lines of the Kelly Criterion. I spoke on this in Switzerland. Guy Spier [holds] a conference called VALUEx. I spoke on this at VALUEx to the group of global managers there. I did not know this was happening, but there was an author in the audience, Christopher Mayer, and he wrote a book, and that’s the book that you all have here. And chapter 10— I didn’t know until it was published and somebody else told me, but chapter 10 is about this approach, my speech and my firm.
Finally, in conclusion I want to leave you with this image here, I think it’s incredibly powerful. Jeremy Siegel is a Wharton professor, and he has, I believe, the most comprehensive data set dating back 200 years. He goes from 1802 to 2006. And what he’s determined, he’s looked at all of these major asset classes, from dollar and gold to bills, bonds, and then stocks or equity. What he’s found is that over the long-term due to a number of economic factors, the return on equity is very consistent at 6.8 percent after inflation. Now you have 2.5 percent inflation and you get to the 9 percent that everybody talks about in the markets.
But here’s what’s really significant. This is all after inflation data. This is real purchasing power. In 200 years a dollars has gone from one, to 6 cents. And that makes sense, we all know we have inflation. That means that inflation took out 94 percent of the dollar.
What I think is surprising is that a dollar, the real purchasing power of a dollar, is now a $1.95 in gold. What a terrible long-term investment gold is. There have been periods—I mean this is a 10-year period, from maybe 1971 to 1981 where it looks like it maybe went from 80 cents to 8 dollars, and that will really jade a generation. But, the fact of the matter is, if you look over the long-term, it hasn’t done much for investors.
Bonds have gone from a dollar to let say, $1,000, that’s decent. But what’s most remarkable, and again, he made this a logarithmic scale because we can’t think about exponents very well. One dollars has not become $1,000 in bonds, but $755,000 in equities. There’s no question which asset class you want to invest in if you’re investing for the long term. I don’t hold any bonds, I mean, I barely have any dollars, I just hold my equity portfolio. And I think that’s really important.
I’d like to share this [shortcut] with you because I find it valuable, I use the Rule of 72 quite a bit when I’m thinking about exponents and exponential growth. The Rule of 72 basically says whatever return you are getting on your investments, divide that number into 72 and that’s how many years it will take for your portfolio to double. So, if you’re getting 9 percent, the S&P plus inflation, your portfolio’s going to double over 8 years. If you have 24 years to go, a million becomes two, then four, then eight. It also works with debt. So if you have a lot of credit cards, you can also use that formula to figure out how quickly that’s going to be doubling. Ok, so with that, that’s the end of my slides, thank you very much.
About The Author: Matthew Peterson
Matthew Peterson is the Managing Partner of Peterson Capital Management, LLC. Matthew has over a decade of experience with global financial services firms including Goldman Sachs, Morgan Stanley, Merrill Lynch, American Express, and Ameriprise Financial. Prior to forming Peterson Capital Management, LLC and launching Peterson Investment Fund I, LP, Matthew split time between Wall Street and London as Capital Markets Manager in the Financial Services Vertical at Diamond Management and Technology Consultants. Matthew worked as a member of both the U.S. and U.K. offices, with expertise spanning from risk management to derivative processing. During his tenure with Diamond, Matthew worked with top-tier investment banks, global payments firms, and international insurance companies to deliver high impact solutions to his clients’ most challenging business problems.
More posts by Matthew Peterson