This article is excerpted from a letter by MOI Global instructor Patrick Brennan, portfolio manager of Brennan Asset Management.
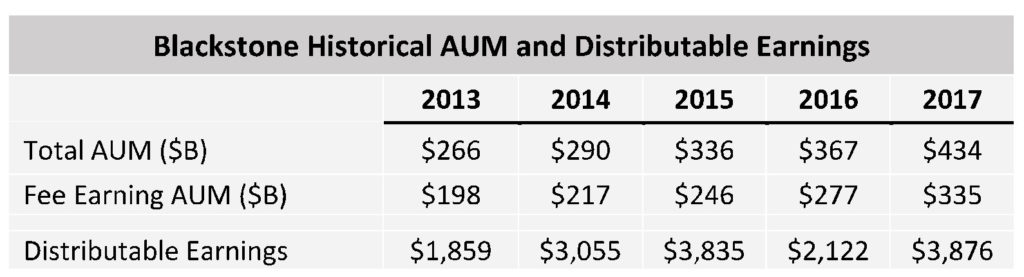
Throughout our past letters, we have discussed how public values and capital structures often look far different than those of private companies and noted how several of our current names would likely be the exact types of names (predictable businesses that generate substantial free cash flows) that have made private equity firms substantial money over the years. The private equity name is a bit of misnomer, considering that the largest firms are now public entities which are now referred to as alternative investment managers. These firms are often in the headlines on a daily basis, given their role in various merger transactions and their ubiquitous capital raising activity. The firms are also regularly lambasted for their extravagant pay to senior executives and are often whipping boys in any discussion about tax fairness. Despite their incredible growth in total assets under management (AUM), the stocks have generally been underperformers. As just one example, Blackstone’s (BX) stock is essentially flat since its public offering in 2007 (they have paid out $16.49 in dividends over this time period), while its AUM has roughly quintupled.
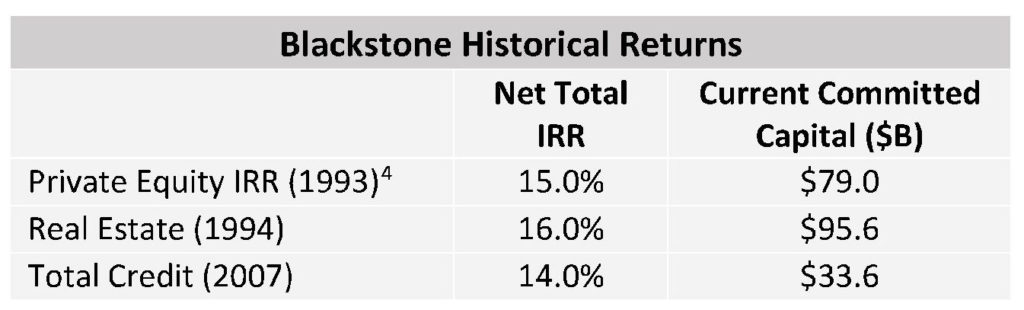
Private equity firms generally pay themselves an underlying management and incentive fee equal to a percentage of total profits above a hurdle rate of return. While the timing of the latter is nearly impossible to predict (and very difficult for investors to model), the carry fees offer enormous payouts over a cycle. And despite the higher fee levels, the alternative managers generally show significant outperformance relative to their benchmarks. Furthermore, investor assets are often locked up for multi-year periods, sometimes as long as 10-20 years, depending on the fund.
Additionally, the alternative managers have successfully expanded their franchises into private credit, real estate, insurance among several other verticals and nearly all have posted strong growth. These characteristics contrast with traditional managers who normally charge only base management fees, offer daily liquidity, have posted mixed results versus benchmarks and have suffered meaningful AUM losses to index funds. As the alternative equity firms are generally structured as partnerships, the vast majority of the businesses’ tax burden is pushed to the individual limited partners. So, which model sounds more attractive? Well, this is more difficult to ascertain if one simply looks at trading multiples, even considering the traditional managers’ significant 2018 stock pullbacks.
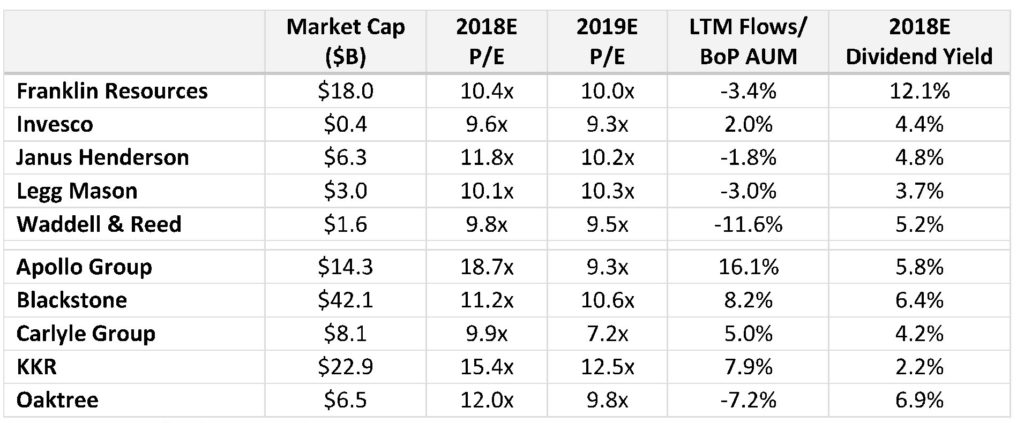
Source: Morgan Stanley Research
There are various explanations for the above contradiction. Some argue that the golden era for private equity cannot continue and returns are likely to compress, especially since such large amounts of committed but uninvested funds (dry powder) must be invested at high prices. Others argue that returns are merely a function of leverage and sector selection, and there is little to no alpha after these adjustments.[3] There is the possibility of tax law change on the carried interest and the certainty of interest deduction limitations. Additionally, a big market pullback will delay performance fees and could meaningfully lower earnings. Finally, these names are complex, have volatile earnings/stock prices and have K1 structures that make them difficult for many institutions to own. While all factors partially explain the valuation differentials, we suspect the last might be the dominant factor.
We have watched these names from a distance for years but passed for various reasons (including in 2010…particularly brilliant on our part), partially because of the worry about a change in the taxation of carried interest (still a concern) and the “cycle” timing. These names will sell off during market turmoil and therefore a better time to purchase would certainly be during a market dislocation. But, as we continued to do work over the past year, we spent more time thinking about the difficulty of trying to recreate these models. It might take 20+ years to create the track record and institutional goodwill that these names have attained. Should the firms technically compare their leveraged returns to leveraged S&P 500 returns? Sure, but how many investors could handle the volatility associated with that strategy? How many institutions have access to the deal flow, contact bases and data from all the various deals closed (and passed on) over time?
It is true that any market pullback will delay performance fees. But, with the private equity industry sitting on nearly $1.7 trillion in dry powder, these names would be well positioned to benefit from market declines. And while these nearly incomprehensible levels of funds might appear impossible to rationally invest, it should be noted that private markets are far larger than in past years with the total percentage of dry powder as a percentage of unrealized fair value actually below its longer-term average.
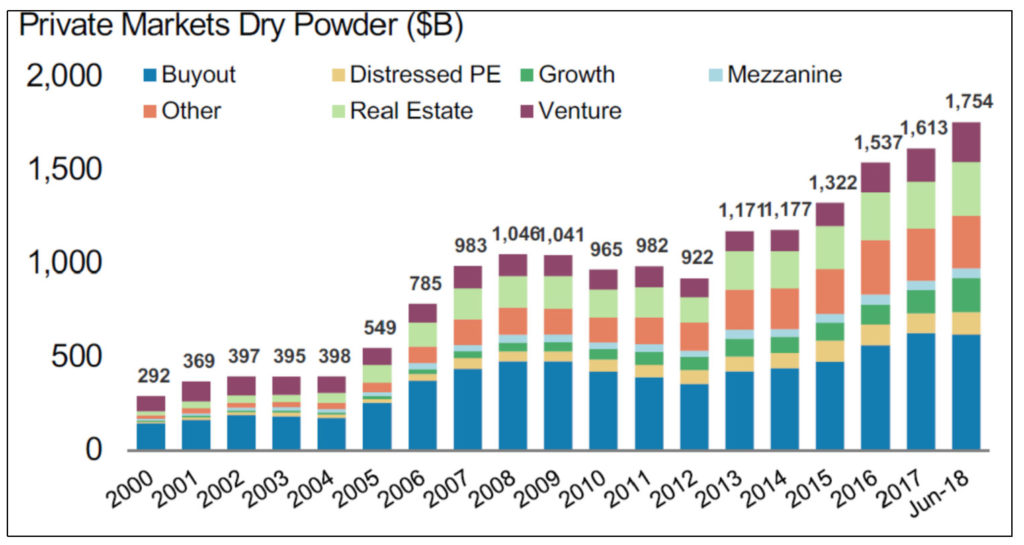
Source: Prequin, Morgan Stanley Research
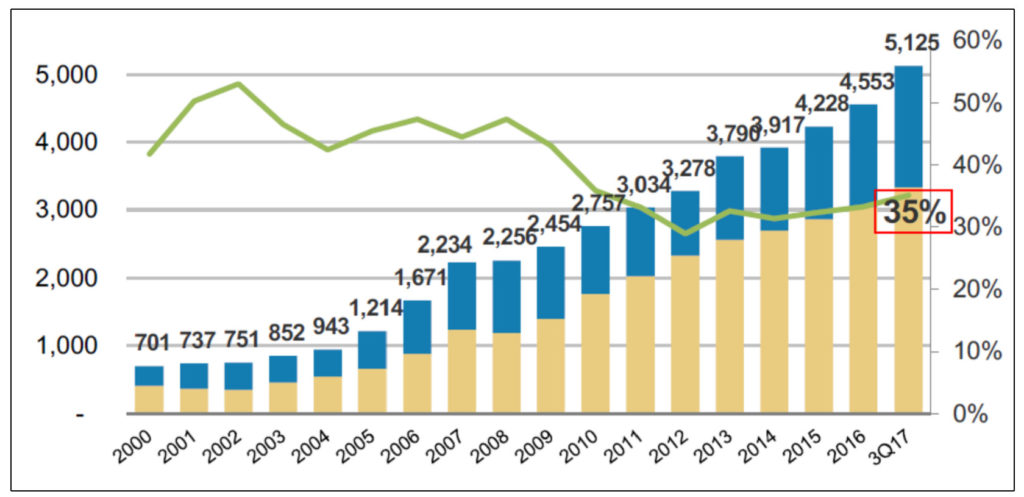
Source: Prequin, Morgan Stanley Research
As noted, the industry’s fund-raising capabilities are immense. We can attest to the difficulty of raising small amounts of money. How likely would it be for a new firm to start at zero and eventually raise over $100 billion? On the most simplistic basis, it is worth asking: “What will be the alternative industry’s organic AUM levels over the next 1, 3, and 5 years?” We suspect the answer is “higher to significantly higher.” At a 2014 investor day, BX estimated fee growth of 12% annually, a 60% discount to historical levels. It is worth noting that some of the frequently discussed structural changes could conceivably help the largest alternative managers. Often the largest, most recognizable alternative managers take market share within the alternative space as institutions consolidate relationships. It is costly to closely track multiple managers and therefore the largest names often benefit when institutions reduce the number of mangers and/or benefit or suffer little damage when institutions reduce alternative allocations.
The alternative asset managers typically are valued on the basis of fee-related earnings, current carried interest and existing balance sheet assets. While one can argue that other firms screen cheaper on these metrics or have more room to grow total AUM (unclear they will actually do so), we believe that BX has the most diverse revenue stream and the strongest fund-raising franchise and therefore initiated a smaller position. Again, it is better to purchase these names during periods of market turmoil and therefore we’ve left substantial room to scale into the positions over time. Other alternative managers, with KKR the most recent, have announced plans to convert into a publicly traded company, willingly choosing to pay taxes in hopes that investors ascribe a higher multiple for the structure simplicity. BX pays less in taxes and such a decision would therefore be even more costly from a tax perspective. While a conversion would undoubtedly move shares higher shorter- term, we hope BX decides against such a move and instead opts to repurchase additional shares. We’ve heard that complex, tax-avoiding firms can actually do fairly well over time.
[3] Financial Analyst Journal Volume 72, July/August 2016: A Bottom-Up Approach to the Risk-Adjusted Performance of the Buyout Fund Market, Jean-François L’Her, CFA, Rossitsa Stoyanova, Kathryn Shaw, William Scott, CFA, and Charissa Lai, CFA.
[4] We show the year of each strategy’s first fund.
Disclaimer: BAM’s investment decision making process involves a number of different factors, not just those discussed in this document. The views expressed in this material are subject to ongoing evaluation and could change at any time. Past performance is not indicative of future results, which may vary. The value of investments and the income derived from investments can go down as well as up. It shall not be assumed that recommendations made in the future will be profitable or will equal the performance of the securities mentioned here. While BAM seeks to design a portfolio which reflects appropriate risk and return features, portfolio characteristics may deviate from those of the benchmark. Although BAM follows the same investment strategy for each advisory client with similar investment objectives and financial condition, differences in client holdings are dictated by variations in clients’ investment guidelines and risk tolerances. BAM may continue to hold a certain security in one client account while selling it for another client account when client guidelines or risk tolerances mandate a sale for a particular client. In some cases, consistent with client objectives and risk, BAM may purchase a security for one client while selling it for another. Consistent with specific client objectives and risk tolerance, clients’ trades may be executed at different times and at different prices. Each of these factors influences the overall performance of the investment strategies followed by the Firm. Nothing herein should be construed as a solicitation or offer, or recommendation to buy or sell any security, or as an offer to provide advisory services in any jurisdiction in which such solicitation or offer would be unlawful under the securities laws of such jurisdiction. The material provided herein is for informational purposes only. Before engaging BAM, prospective clients are strongly urged to perform additional due diligence, to ask additional questions of BAM as they deem appropriate, and to discuss any prospective investment with their legal and tax advisers.
About The Author: Patrick Brennan
Patrick Brennan is the founder and portfolio manager of Brennan Asset Management, a Registered Investment Advisory firm based in Napa, CA, which utilizes a concentrated value investing strategy. Patrick has given presentations at multiple value investing conferences, including presentations to The New York Society of Security Analysts (NYSSA), The Nebraska Society of Securities Analysts and presentations on various names at the VALUEx Vail Conferences. Patrick coauthored an article on tracking stocks with Lawrence Cunningham for The Financial History Magazine and Patrick was featured in a write-up of Liberty LILAK in The Private Investment Brief. Prior to founding Brennan Asset Management, Patrick managed portfolios and led research efforts at two value investing firms in California: Hutchinson Capital Management and RBO & Co. Previously, Patrick worked at Mark Boyar & Company, where he led the firm’s research team and helped manage $800 million of assets across individual portfolios, institutional accounts and a mutual fund. Patrick also worked for six years in investment banking and equity research with Deutsche Bank, CIBC World Markets and William Blair & Company. Patrick graduated summa cum laude from the University of Notre Dame with a degree in economics and was inducted into Phi Beta Kappa. Patrick received the Chartered Financial Analyst (CFA) designation in 2002 and is a member of the CFA Institute (formerly AIMR). Patrick is originally from Omaha, Nebraska.
More posts by Patrick Brennan