This article by MOI Global instructor John Lewis is excerpted from a letter of Osmium Partners, based in Greenbrae, California.
Spark Networks, Inc.[1]provides online personal services in the United States and internationally. The company creates communities that help individuals to form life-long relationships with others who share their interests and values. Its primary properties include JDate.com and ChristianMingle.com, which are communities for the singles of Jewish and Christian faiths. The company was incorporated in 2007 and is headquartered in Berlin and New York. (LOV is a holding across all funds.)
• Spark revenue guidance is for $127-133 million in subscription revenue in 2018 (pre-merger Spark was at $27 million in revenue)
• 8 brands in 29 countries
• Guidance is for at scale 30-40% adjusted EBITDA margins
• Spark is valued at 1.3x EV/revenue vs. Match 9.0x ev/revenue
• Spark guidance is for 10-14% organic growth
• EBITDA margins guidance is for 50% margin expansion with 40% incremental EBITDA margins
• Spark is 8% the size of Match and 1/100th the valuation
• Key Brands: Elite Singles (82% college educated, decent market share in a number of countries), bought e-Harmony’s European operations called eDarling, JDate, ChristianMingle, LDS Singles, & Silver Singles
Spark: Silver Singles over 50 dating
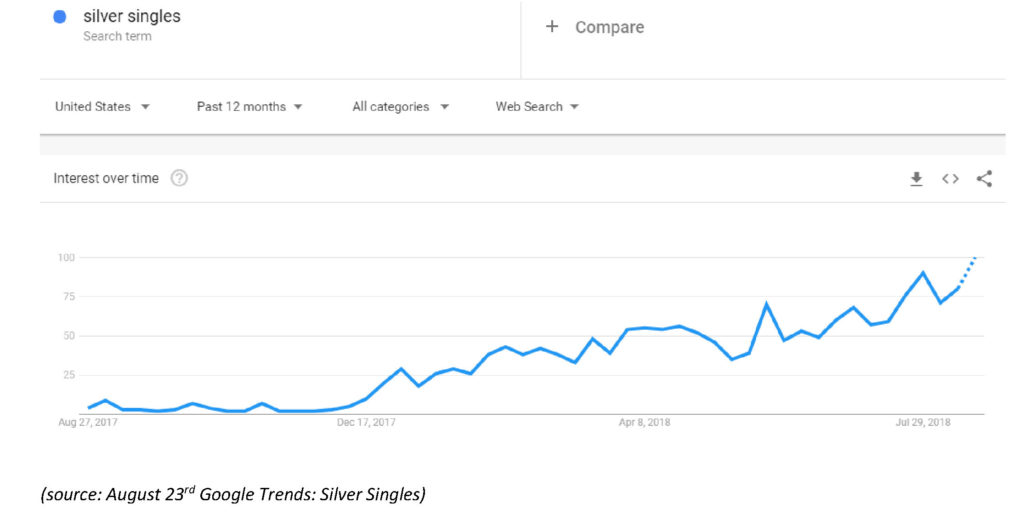
LOV also has a homegrown new brand potential with, for example, Silver Singles, with what we believe to be a new successful launch in mid-December 2017. From a base of near zero in December 2017, Silver Singles in 1Q18 achieved 15% of total registrants. Silver Singles has subscription packages in 3, 6, and 12 month increments charging $115, $165, and $240 respectively. 100K subscribers at a purchase price between $100-200 would generate $10-20M in revenue. Due to marketing investments in Silver Singles growth 2018 EBITDA is being reduced by $5-6mm (without investments EV/EBITDA’18 is 7.8X). Spark has guided to cash flow positive 2H18 for Silver Singles.
Either through M&A or organic growth, we think LOV could reach scale of $200M+ in revenue over the next 2-3 years. We believe at $200-225 million Spark could reach 30% EBITDA margins, which would imply $4.60 a share in EBITDA. Spark has $40 million in untapped lines of capital for M&A. Spark is taking a much more aggressive approach on getting their story out, with two road shows with two investment banks this summer: Cowen and Stifel. Immediately following earnings on August 30th, Spark will present in San Francisco at a conference on September 6th. We think the upside is significant with modest execution in growing revenues.
Spark Metrics:
North America Subscriber Growth
2015 average – 15,240
2016 average – 46,453 (205% growth yoy)
2017 average – 83,870 (81% growth yoy)
2017 ending – 158,000
International Subscriber Growth
2015 average – 266,675
2016 average – 270,823 (2% growth yoy)
2017 average – 295,533 (9% growth yoy)
2017 ending – 307,000
Total Registrations
2015 – 5.8 million
2016 – 6.9 million (19% growth yoy)
2017 – 8.5 million (23% growth yoy)
______
[1] Market price as of the date of dissemination of the letter
Certain factual and statistical (both historical and projected) industry and market data and other information contained herein was obtained by Osmium Partners from independent, third-party sources that it deems to be reliable. However, Osmium Partners has not independently verified any of such data or other information, or the reasonableness of the assumptions upon which such data and other information was based, and there can be no assurance as to the accuracy of such data and other information. Further, many of the statements and assertions contained herein reflect the belief of Osmium Partners, which belief may be based in whole or in part on such data and other information. The information contained herein is provided for informational purposes only. This is not an offer to sell, or a solicitation to buy, limited partnership interests in Osmium. An investment in Osmium is not suitable for all investors. Graphs/charts are provided for illustrative purposes only and should not be relied on to form an investment decision. Stocks mentioned in the newsletter do not constitute a recommendation to buy or sell the individual securities.
About The Author: John Lewis
Mr. John Hartnett Lewis co-founded Osmium Partners, LLC in 2002 and serves as its Chief Investment Officer and Managing Partner. Mr. Lewis served as a Director of Research at Retzer Capital. He was an Equity Research Analyst at Heartland Advisors, Inc. from March 1999 to January 2001. He served as the President of the University of San Francisco MBA Investment Group, where he managed a small portion of the school's endowment fund. Mr. Lewis served as a Director of Spark Networks, Inc. since July 2, 2014 until November 2, 2017. He served as a Director of Intersections Inc. since October 2015 until August 8, 2017. Mr. Lewis is a Guest Columnist for TheStreet.com. He received an M.B.A. from the University of San Francisco in 1999 and a B.A. from the University of Maryland in 1996.
More posts by John Lewis