This article is authored by MOI Global instructor Steve Gorelik, portfolio manager at Firebird Management.
Steve is an instructor at Best Ideas 2025.
In the last five years, only 25% of the 620 or so companies in the S&P 500 index managed to outperform the benchmark’s 15.5% annualized return. While some of the best performing names, like Nvidia or Eli Lilly, are well known to the public, one relatively obscure category of companies has done surprisingly well against a high-performing benchmark.
As of this writing, 26 publicly listed companies in the distribution business have market caps of around $1 billion or larger. Of the 26 companies on our list, 14 (or 54%) delivered returns better than the S&P 500 over the last five years. Moreover, the top five performers, which have annualized at 25% or better, have come from five different industries, suggesting that the business model, not the end markets, is the reason for the strong performance.
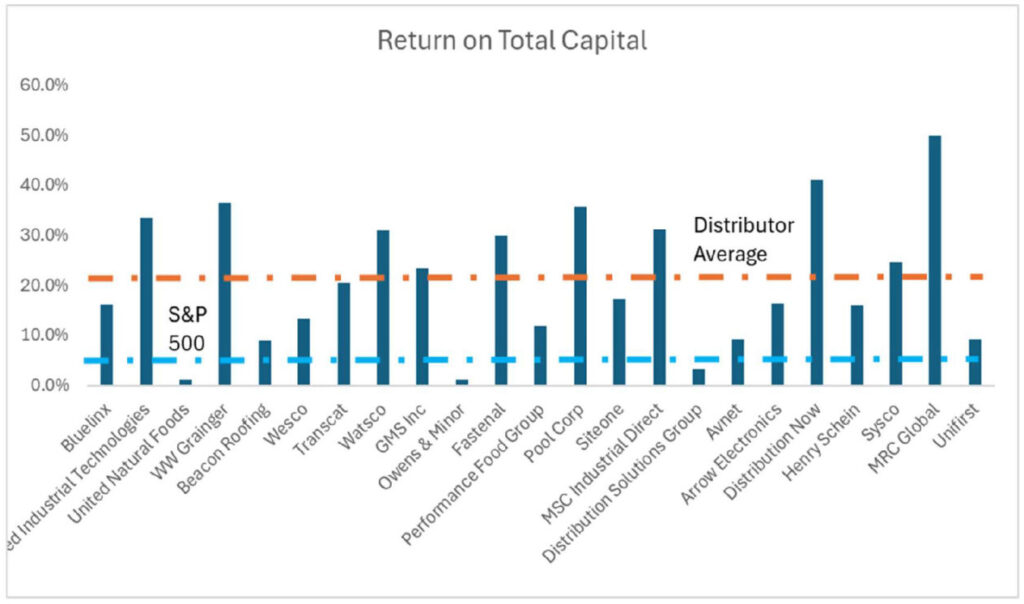
The advantage of the distributor’s business model comes from the high volume of small transactions going through large warehouses. While their margins are usually small, the capital efficiency is high due to the high velocity of sales and relatively small capital expenditures needed to maintain the distribution network. On average, distribution companies generate a return on total capital employed[1] in high teen/low 20’s percentage. This compares to roughly 4-5% generated by the S&P 500.
 Source: Bloomberg, Firebird Value Advisors Research
As an aside, distribution businesses are unsung heroes of the consumer-driven economy. The coordination and technology required to get goods, some of which are perishable, from thousands of suppliers to tens of thousands of customers in a short period is truly remarkable. It is also mind-boggling that they do it profitably while marking up the cost of the products by only 15% – 30%.
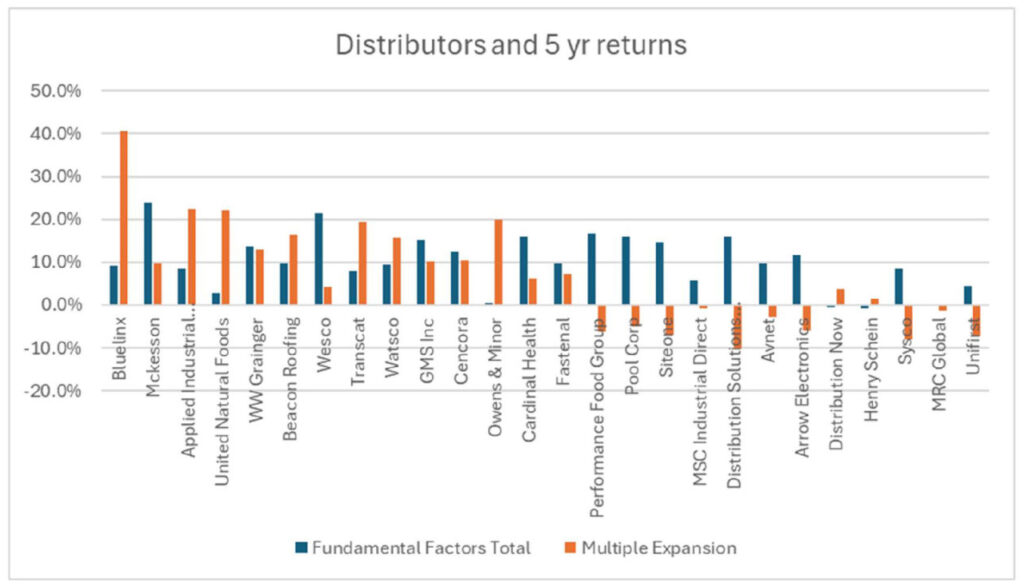
While half of the companies outperformed the market, the other half did not. To better understand the industry, we broke down the returns over the last five years into fundamental factors (revenue growth, margin expansion, dividends, share buybacks) and non-fundamental reason for multiple expansion. Unsurprisingly, the most common predictor of whether the company did well was the multiple expansion, which contributed 10% or more of annualized returns in some cases.
 Source: Bloomberg, Firebird Value Advisors Research
With this in mind, the key question is which factors are more likely than not to result in multiple expansion. To do that, we ran a regression analysis with the following factors:
- Revenue Growth – Did the company generate revenue growth of at least 5% per annum between 2018 and 2023
- Share Repurchases – Did the company buy back more than 2% of shares per year in the last five years
- Starting FCF Yield – Did the company trade at more than 7% FCF yield in the beginning of 2019
- Significant acquirer – Did the company spend more than 50% of its free cash flow on M&A
- Margin expansion – The change in operating cash flow margin between 2018 and 2022
Given that we have less than 30 observations, our analysis is not of an academic paper quality, but we think we have enough data to be “approximately right.”
The analysis suggests that the above factors, high starting free cash flow yield and high revenue growth, contribute positively to multiple expansion. Eight out of 14 companies that outperformed the market had both features, and none of the companies that underperformed the market had them. Both components must be present, as neither one of them is predictive on a standalone basis.
The portion of free cash flow spent on acquisition has positive predictive power as well, but it is almost fully oset by the negative influence of companies with high revenue growth and a high percentage of cash on M&A.[2]
The other relevant factor is a positive change in operating cash flow margin. For each 1% improvement in the operating cash flow margin, the companies, on average, generated 2.4% of multiple expansion IRR per year.
Distributor margins are somewhat cyclical and dependent on macro factors such as inflation, supply chain disruptions, and the strength of end market demand, which impacts supplier rebates. Given that distributors operate at low margins, even a 1-2% change in profit margin can have a significant impact on their financials and, evidently, on stock market performance.
The outsized impact can go both ways. When the cyclical factors are working against distributors, as we are seeing currently in the food distribution space, these companies can experience significant declines in negative performance. The interplay between cyclical margins and macroeconomic conditions adds a layer of complexity to evaluating these companies and argues for an active management of these investments rather than a buy-and-hold approach. That said, the distribution sector is an essential segment of global trade and a fertile ground to look for investment opportunities.
[1] For the purposes of this calculation Return on Total Capital Employed is calculated as Cash Flow from Operations – Capital Expenditures/(Total Assets – Net Working Capital – Intangible Assets)
[2] Of the ten companies that spend more than 50% on M&A, 9 are also considered fast growing. While M&A factor technically delivers 28% of annualized IRR, the fast growing with M&A factor takes away 31% of IRR more than fully osetting the benefit. This is why we are choosing to ignore this data point.
Members, log in below to access the restricted content.
Not a member?
Thank you for your interest. Please note that MOI Global is closed to new members at this time. If you would like to join the waiting list, complete the following form:

About The Author: Steve Gorelik
Steve Gorelik is the Fund Manager of Firebird U.S. Value Fund as well as portfolio manager of Firebird’s Eastern Europe and Russia Funds. He joined Firebird in 2005 from Columbia University Graduate School of Business while completing education from a highly selective Value Investing Program. Prior to business school, Steve was an operational strategy consultant at Deloitte working with companies in various industries including banking, healthcare, and retail. He holds a BS degree from Carnegie Mellon University as well as a CFA (chartered financial analyst) charter and a membership in Beta Gamma Sigma honor society. Steve serves on the boards of Teliani Valley (Georgia), Arco Vara (Estonia), and Pharmsynthez (Russia). He speaks Russian, English and his native Belarussian.
More posts by Steve Gorelik