This article is authored by MOI Global instructor Andrew Macken, co-founder and chief investment officer of Montaka Global Investments. Andrew is an instructor at Asian Investing Summit 2018, the fully online conference featuring more than thirty expert instructors from the MOI Global membership community.
When Leonardo da Vinci was sketching out his design for one of the earliest parachutes in the year 1483, he no doubt understood the consequences of such a device failing. It would not have taken Leonardo much time at all to realise that two would be better than one. Today, skydivers nearly always jump with a main parachute and a reserve. The theory is as follows: if one parachute has, say, a 1 per cent chance of failing; then by carrying two, the chance of failure reduces to 0.01 per cent, one hundred times less. We are even more conservative. Should we ever find ourselves jumping out of an aeroplane, we would not be satisfied with two parachutes: we would want three.
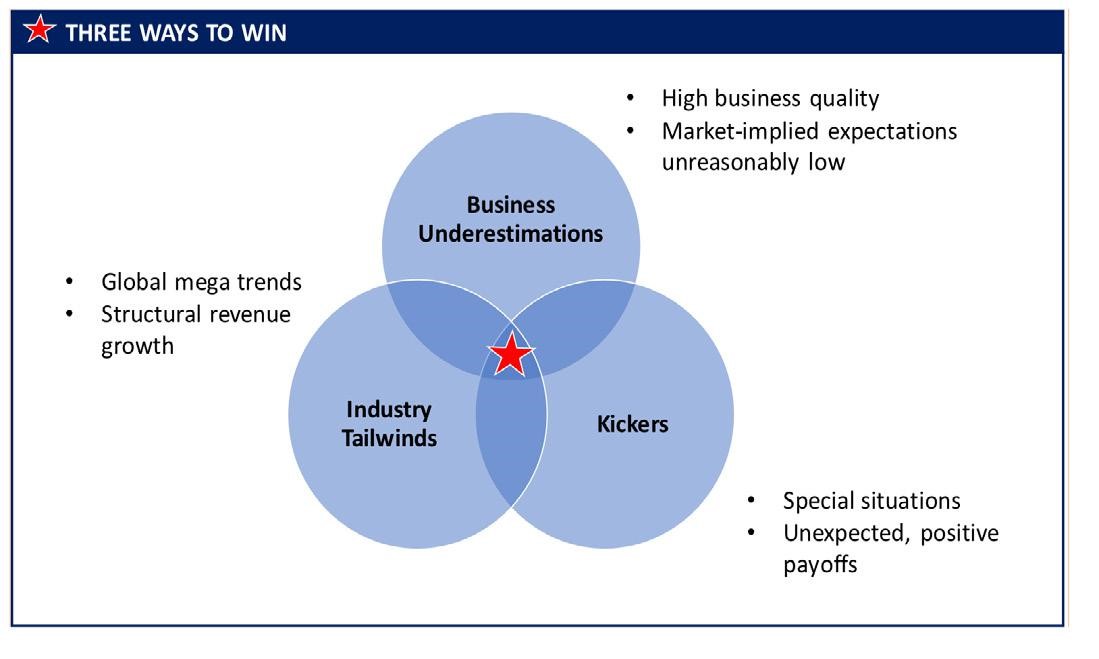
This is how we approach equity investing with a primary focus on capital preservation at all times. We are not satisfied with one, or even two ways in which we can profit from an investment. We want three. For the same reason that skydivers choose multiple parachutes, the more ways in which we can win on an investment, the lower the probability of loss.
The combination of three different ways in which we can win on an equity investment results in a highly-favourable probability distribution of potential outcomes. If we are wrong on one, or even two dimensions of the thesis, our downside should still be somewhat limited if we are right on the third. While if we are correct on two, or even three dimensions, then the upside should be large. Limited downside with large upside are the bets that investors should spend their time seeking to identify.
The Intersection of Three Ways
We consider opportunities to profit from an equity investment along three broad dimensions:
(i) Business Underestimations;
(ii) Industry Tailwinds; and
(iii) Kickers.
We believe each of these dimensions offer opportunities for investors to profit at different times. But in a world in which predicting the future accurately and sustainably is impossible, we believe it is the intersection of these dimensions in which investors are offered the greatest “upside versus downside” potential.
(I) Business Underestimations
The primary dimension along which an equity investment opportunity should be considered relates to the underlying business itself. In practice, we ask ourselves two specific questions – both of which require the answer “yes” for us to be satisfied: (i) Is the quality of the business high? And (ii) Are the market’s expectations for the future performance of the business unreasonably conservative?
We define high business quality as the ability for a business to earn high returns on invested capital for a sustained period of time. Such an ability can only stem from a business owning some “asset” that cannot easily be recreated by a competitor. Economists articulate this idea with the saying of “high barriers to entry.” Put simply, if your business can be easily and cheaply copied by a competitor, then it is not of high quality and the returns generated by your industry are unlikely to be above-average over time.
If, on the other hand, you own an asset that is near-impossible for a competitor to recreate – let’s say, for example, the Facebook platform – then you can expect to leverage your asset to generate very high returns on invested capital for a sustained period of time. And with higher returns, comes higher earnings and, typically, a higher stock price. These are the businesses we look for.
But high business quality alone is not enough. One also needs to be able to buy said business for less than it is worth. Only then can the investor expect to generate outsized returns in the equity markets. There is no amount of “quality” that can offset overpaying for an asset.
To assess whether or not a business is undervalued, we begin by viewing each and every stock price in the world as a numerical representation of future market-implied expectations. These expectations relate to the key value drivers of the business: revenue growth, profit margins, capital requirements, and others. As a stock price rises, this is equivalent to the market’s expectations increasing; and vice versa.
Through this lens, a stock is undervalued when its market-implied expectations are unreasonably conservative. As the saying goes: ‘To outperform the market, you have to be different and you have to be right.’ By understanding how your own expectations differ to those of the market’s, you will at least know where you are different and why you believe you are right.
The identification of a high-quality business with unreasonably conservative market-implied expectations is a great starting point for the investor. Success along this dimension alone is often more than enough to make money. But investing involves luck – which can sometimes go against you. So we look for two more ways to win – to reduce the chance of loss.
(II) Industry Tailwinds
The second way we can win is to identify industries that are positively exposed to global mega trends. Such structural trends can provide a sustained tailwind to the growth of businesses that are strategically well-positioned. Investing with tailwinds is often advantageous: businesses in industries that are growing naturally will typically find it much easier to grow revenues, expand profit margins and ultimately earn higher returns on capital investment.
One such global mega trend is the growth in the Asian middle-class associated spending. Based on analysis by Brookings* , of the US$29 trillion increase in global middle class* spend between 2015 and 2030, more than 84 per cent will stem from Asia Pacific. And of this, the vast majority stems from China and India.
Global Middle Class Spend (PPP, constant 2011 US$ trillions)
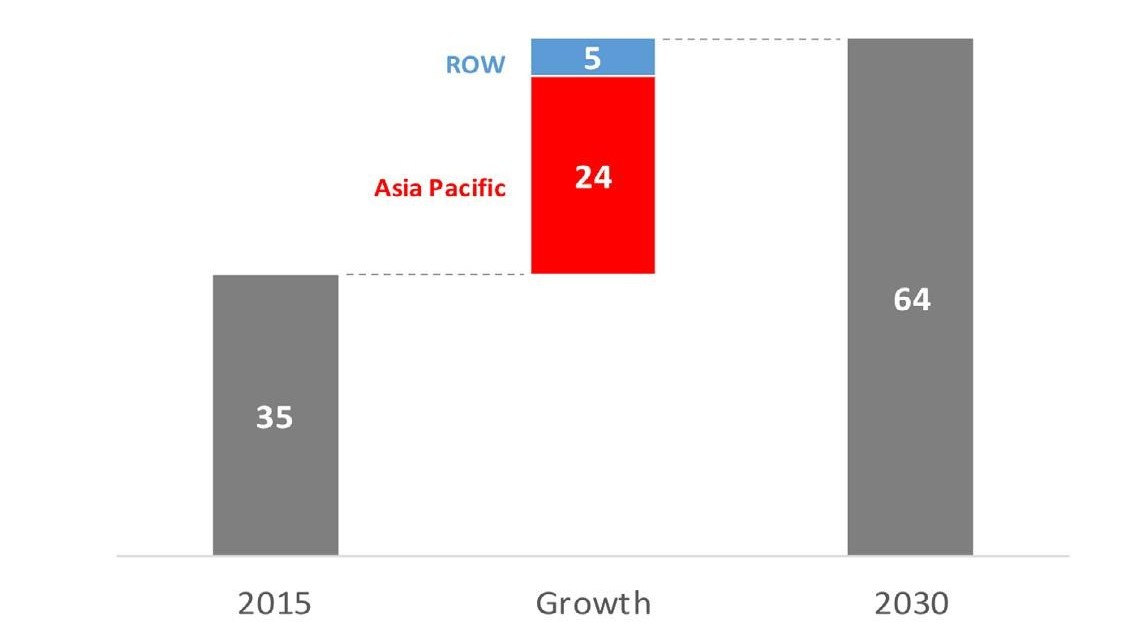
Source: Brookings (2017);MGIM.
Today, there are around 1.5 billion members of the Asian Pacific middle class. By 2030, this number will be closer to 3.5 billion. As middle-class wealth increases, the middle class population will travel even more than they do today. Airbus (Euronext: AIR), a high-quality aircraft manufacturer with few competitors, will produce many of the planes that will be required to satisfy the demand for flights out of Asia for the coming decades.
Similarly, TravelSky Technology (HKEx: 696), the Chinese global distribution system monopolist, will take a cut of nearly every aeroplane ticket that is booked in China. TravelSky owns an unrivalled ticket distribution network of more than 70,000 sales terminals in more than 8,000 travel agencies across China. This network connects travel agents to more than 129 commercial airlines around the world for ticket distribution.
Another global mega trend is that of the aging population. Did you know that around 10,000 US citizens turn 65 years old every day? The ratio of the older population to the working age population has started to accelerate upwards in the United States, as illustrated by the following chart. But this is not just an American dynamic. Populations are aging all over the world in countries like Brazil, Mexico, the United Kingdom, Western Europe, China, Japan and Australia. Most of the world’s recent economic growth has stemmed from these economies with aging populations. And this is one reason why future global economic growth may not be as strong as it has been in recent decades.
Increase in Old-Age Dependency Ratio over 40yr Period — People older than 64 years per 100 people of working age (15-64 year olds)
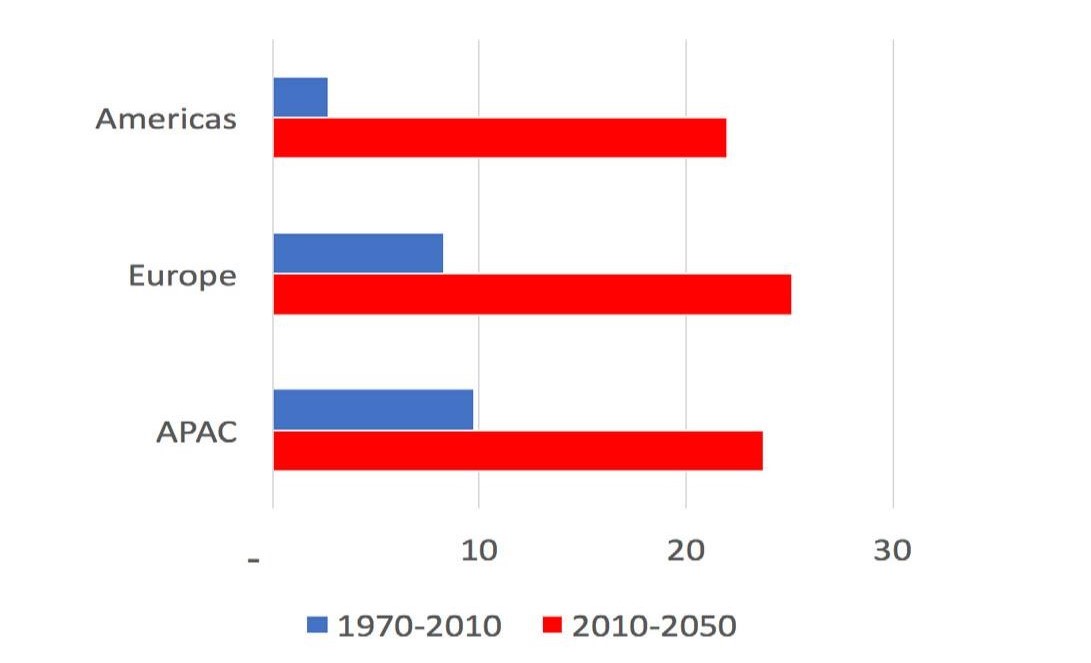
Note: Americas = US, Mexico, Brazil; Europe = UK, Germany, France, Italy, Spain, Russia; APAC = China, India, Japan, Australia.
Source: Pew Research Center; World Bank; Index Mundi; ABS; MGIM.
For some industries, however, aging populations represent a wonderful demand tailwind. Consider Essilor International (Euronext: EI), the global leader in eyeglass lenses. Of the 7.2 billion global population today, 4.4 billion people require vision correction but only 1.9 billion people have received vision correction. More than 2.5 billion remain uncorrected; and another 5.8 billion people worldwide are not equipped with sunglasses to protect against UV rays and blue light.
And this situation will only get worse (or better for Essilor) as populations around the world grow older. The percentage of individuals requiring vision correction is over 70 per cent for persons at the age of 45. But this increases to 95 per cent for persons at the age of 70, as the age-related ability to focus on near objects (presbyopia) continues to deteriorate. Essilor is well positioned to capture this structural growth in global eyeglass lenses demand.
Finally, global mega trends can relate to structural changes within industries, rather than to the industry as a whole. Of course, in this case there are winners and losers. Consider the advertising industry that used to be dominated by TV, magazines, newspapers and radio. Today, digital advertising dominates – and has been capturing more than 100 per cent of annual industry growth for many years now.
Change in US Advertising Spend, 2014-2020E (US$ billions)
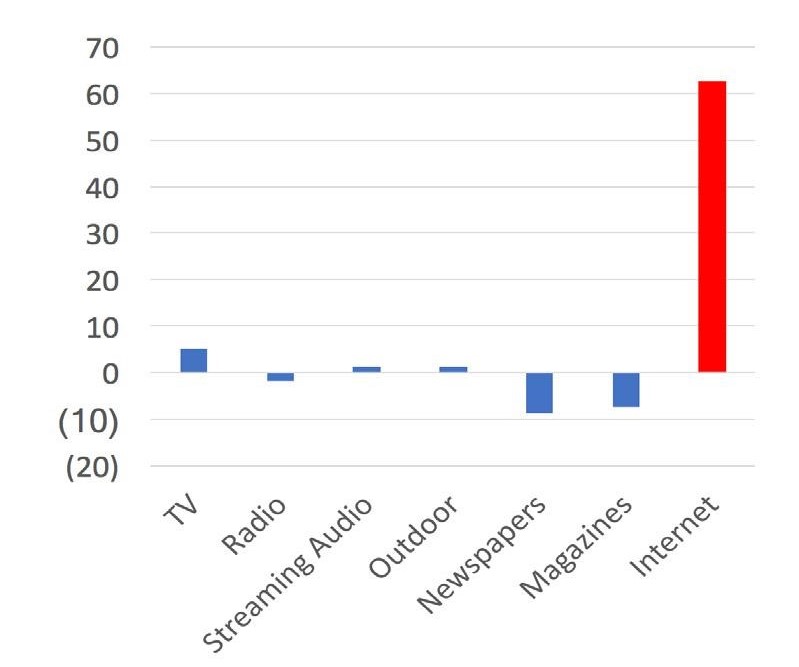
Source: Morgan Stanley.
The reason is simple: unlike offline forms of advertising, digital can be highly-targeted and tailored to the individual consumer. This form of advertising results in a significantly higher return-on-investment for marketers and has, therefore, been attracting a large and growing share of ad spend.
As this trend continues, ad spend will be won by those advertising platforms which have a large number of highly-engaged users that continually disseminate personal information that marketers (and increasingly artificial intelligence algorithms) find valuable. We have, of course, just described Facebook– the largest social network in the world with more than 2.0 billion highly-engaged monthly active users. Facebook stands to benefit from this continued shift from offline to online advertising.
(III) Kickers
Kickers, as the name suggests, are special situations that could result in an unexpected positive payoff. Like a free option, a kicker has an asymmetric probability distribution of possible outcomes ranging from neutral to highly-positive.
A common example of a kicker for the equity investor would be the potential for a business in your portfolio to be acquired by a competitor. While the outcome is always unpredictable, should the scenario arise, a bid premium typically causes the stock price to jump on the day of the announcement.
Another example might be an under-appreciated minority equity stake owned by a business. If, for example, the equity stake is carried at cost, then the true market value potential of this asset could result in a wonderful gain in the future. Consider Alibaba (NYSE: BABA), the largest e-commerce platform in the world, based in China. Hidden on its balance sheet is a 33 per cent economic interest in Ant Financial. Ant Financial is the largest payments business in China and already the world’s most valuable “fintech” firm, with 520 million payments customers in China alone.
* * *
Now we put into practice what has been described. Here are three businesses, from three different geographies across three different industries. And we believe, in each case, investors have three ways to win.
St. James’s Place (LSE: STJ)
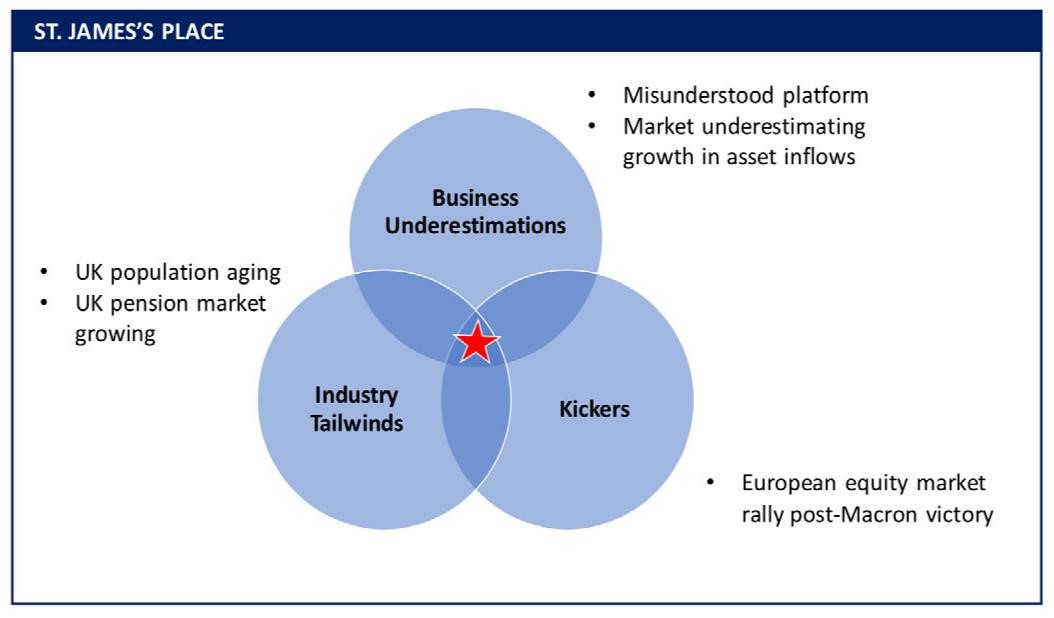
While St. James’s Place (SJP) is typically viewed as “just another” wealth manager, we believe it is a misunderstood platform business. Upon the SJP “infrastructure” of shared advice-related services, systems and centralized fund manager procurement, semi-autonomous Partner businesses provide advice to more than 600,000 clients across the UK. As the network of Partner businesses grows, so too does the scale of the platform which drives shared cost synergies and even greater buying power with global fund managers.
On top of this, the market appears to be dramatically underestimating the asset inflows into the SJP network. Not only are SJP’s 3,500 individual advisors increasing share of client wallet and new clients, Partner businesses are adding new advisors and SJP is adding new Partner businesses. The market does not appear to be recognizing the full extent of these numerous levers for growth. Said another way, we believe growth will be much higher than what the current stock price is implying.
SJP also benefits from structural tailwinds in the UK wealth management market. As the UK population ages, becomes wealthier and lives longer the need to save is increasing. Yet today only around one third of the UK population has a pension account and the average pension “pot” is less than £30,000. Driven by this demographic change the overall wealth market is forecast to grow by up to 5 per cent annually into the next decade*.
The “kicker” for investors in SJP relates to the significant share of SJP’s £86 billion funds under management (FUM) exposed to Europe/UK. More than one-third of SJP’s underlying exposure is to this region and stands to benefit from the potential “post-Macron” equity rally – to the extent it materialises for any sustained duration.
Insperity (NYSE: NSP)
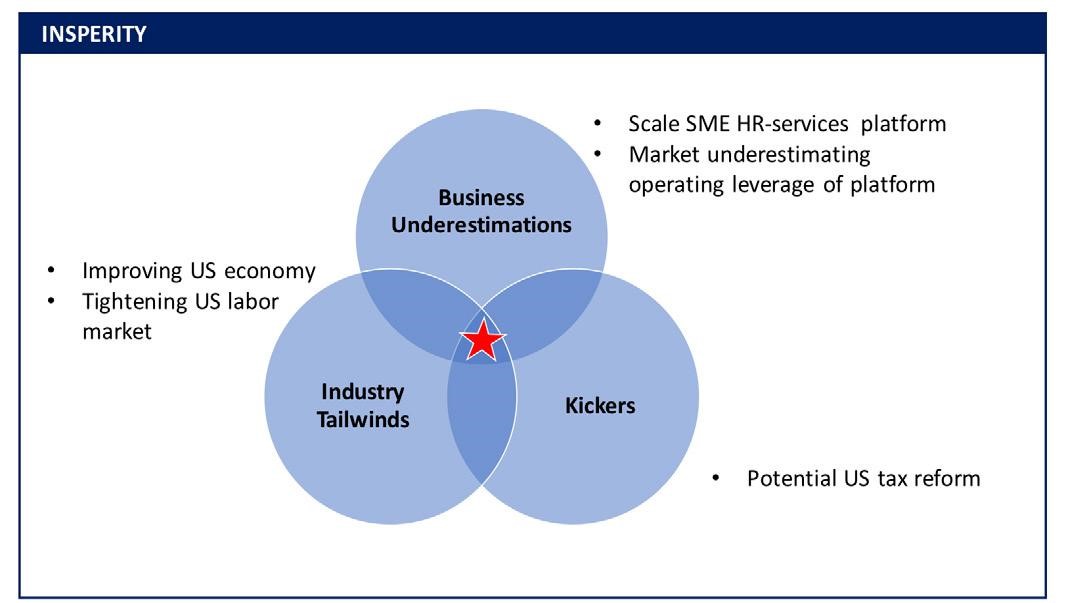
Insperity is a professional employer organization which assists small and mid-sized businesses across the US in managing their employees. Whether it is payroll, health insurance or compliance: Insperity collects around US$240/month per employee to manage these aspects of HR on behalf of their clients. Insperity has leveraged its growing sales and marketing team to grow its client-worksite employee levels to over 180,000 today, up by more than 60 per cent from five years ago.
The market appears to be underestimating the extent to which Insperity’s cost base can be leveraged. By this we mean, the market is underestimating the potential for profit margins
to expand as the business continues to grow. With much of Insperity’s HR platform already built in the cloud, these costs are more fixed than variable. This means the incremental profit generated by adding the next member onto the platform will be higher than for the last member.
Furthermore, while the sales and marketing costs associated with adding new clients is high, the cost of retaining is significantly lower. As Insperity remains in a high growth phase, the market appears to be extrapolating the current high marketing expense (as a per cent of sales into the future). We believe future profit margins will be significantly higher than those currently being implied by the market.
Insperity’s customers are small and medium-sized businesses in the US. As these businesses do better, they hire more people and this is a positive for Insperity. Not only have business conditions been improving in the US over recent years, there is clear evidence of wage growth. (This is the reason the Fed has started to hike interest rates in recent years). This is a tailwind for Insperity. Given Insperity takes a cut of client-worksite employee wages, as wages grow so too does Insperity’s revenue.
The “kicker” for Insperity relates to the potential for US tax reform under a Republican controlled White House and Congress. Insperity generates all of its earnings in the US and pays a high income tax rate of 35-40 per cent. The benefit of any corporate tax reform to Insperity would be particularly high.
Naspers (JSE: NPN)
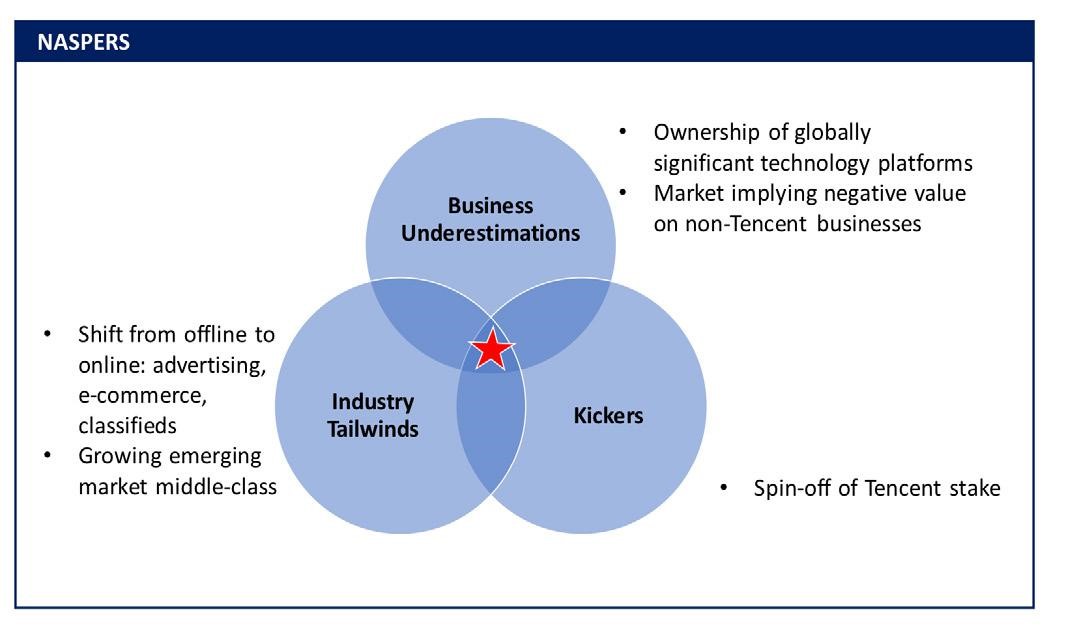
Naspers is a South African-based holding company. By far, the most valuable asset in Naspers’ portfolio is its 33 per cent ownership stake in Tencent (HKEx: 700). Tencent owns the most popular messaging app in China, called WeChat. More than 900 million Chinese monthly active users spend around two hours per day in the app on average. The reason? The app itself is essentially a platform for millions of other apps owned by third-parties. There is an entire ecosystem inside the app that provides users with services across numerous dimensions: gaming, social, banking, e-commerce, payments and video, just to name a few.
What Tencent owns is the mother of all online technology platforms. Actually, it is a technology “platform of platforms”. The platform is so powerful that nearly all third-party businesses need to have a presence inside Tencent’s ecosystem. This results
in enormous bargaining power accruing to Tencent. Indeed, this results in Tencent becoming an effective shareholder in all of the businesses sitting on its platform.
And built in software, the platform allows Tencent to collect an enormous amount of privileged and self-updating customer and business data to which no one else has access. Tencent can use this data to tailor individualised offerings to members in the ecosystem. For instance, in recent years Tencent has started a small, but rapidly-growing, digital advertising business. This side business is effectively the Facebook of China. And we believe the market is still yet to fully recognize the value of what Tencent is creating.
So why not just own Tencent? Why own Naspers? Well, by owning Naspers, an investor gains exposure to a number of other exciting online technology platforms located in rapidly-growing regions around the world. For instance, Naspers owns equity stakes in:
• OLX – largest online classifieds in India, Brazil, Pakistan, Poland;
• Avito – largest online classifieds in Russia;
• PayU – online payments in Asia, Eastern Europe, LATAM, Africa;
• Flipkart – Indian e-commerce platform;
• Mail.Ru – owner of VK, the Facebook of Russia; and
• MakeMyTrip – Indian online travel agent.
And here is the kicker. At its current stock price, a Naspers investor is not paying anything at all for these equity stakes. Indeed, the market value of Naspers’ stake in Tencent is worth more than the entire Naspers enterprise. Should Naspers announce a restructure of its Tencent stake, we believe the stock would rerate immediately.
Here, again, we believe we have three ways to win.
* * *
This is how we believe an equity portfolio should be constructed. And this is how we construct the portfolios of the Montaka strategies. At the portfolio level, we are selectively diversified across geographies, industrial and currencies – just like many passive funds; while at the stock level we look for three ways to win.
If the above sounds to you like a sensible way to invest, then we would agree. And it is interesting to observe how this approach stands in direct contrast to “passive investing” which is enormously popular right now. Passive investing involves buying a small amount of many businesses to completely diversify away all risks except for the market risk. The problem, of course, is that passive investors also diversify away all chance of generating outsized returns in the market.
Instead, a selection of highly-targeted bets in which you have three ways to win can be made across regions, industries and currencies. A portfolio constructed this way retains much of the diversification benefits of a passive strategy but also retains the opportunity to win on each and every bet. The investor has a good chance of generating outsized returns, in other words.
This document was prepared by Montgomery Investment Management Pty Ltd, AFSL No: 354 564 (Montgomery) the trustee of the Montaka Global Fund. Montgomery Global Investment Management Pty Ltd is the Investment Manager of the Montaka Global Fund and an Authorised Representative (AR No: 001007050) under the Montgomery Investment Management Pty Ltd AFSL. Montaka Global Investments provides research services to Montgomery Global Investment Management. The information provided in this document does not take into account your investment objectives, financial situation or particular needs. You should consider your own investment objectives, financial situation and particular needs before acting upon any information provided and consider seeking advice from a financial advisor if necessary. Future investment performance can vary from past performance. You should not base an investment decision simply on past performance. Past performance is not an indicator of future performance. Investment returns reviewed in this document are not guaranteed, and the value of an investment may rise or fall. This document is based on information obtained from sources believed to be reliable as at the time of compilation. However, no warranty is made as to the accuracy, reliability or completeness of this information. Recipients should not regard this document as a substitute for the exercise of their own judgement or for seeking specific financial and investment advice. Any opinions expressed in this document are subject to change without notice and MGIM is not under any obligation to update or keep current the information contained in this document. To the maximum extent permitted by law, neither MGIM, nor any of its related bodies corporate nor any of their respective directors, officers and agents accepts any liability or responsibility whatsoever for any direct or indirect loss or damage of any kind which may be suffered by any recipient through relying on anything contained in or omitted from this document or otherwise arising out of their use of all or any part of the information contained in this document. MGIM, its related bodies corporate, their directors and employees may have an interest in the securities/instruments mentioned in this document or may advise the issuers. This document is not an offer or a solicitation of an offer to any person to deal in any of the securities/instruments mentioned in this document.
About The Author: Andrew Macken
Andrew Macken is the Co-Founder and CIO of Montaka Global Investments, a global equity manager based in Sydney and New York. Prior to establishing Montaka, Andrew worked as a senior member of Jim Chanos’ research team at Kynikos Associates, a global equity long/short fund based in New York. Andrew holds a Master of Business Administration (Dean’s List) from the Columbia Business School in New York. Andrew also graduated with High Distinction with a Master of Commerce; and First Class Honours with a Bachelor of Engineering from the University of New South Wales in Sydney.
More posts by Andrew Macken