This article is authored by Travis Cocke, MOI Global instructor and chief investment officer of Voss Capital. Travis originally shared this piece with our members in late 2016. It was very well received at the time and remains highly relevant.
Is it possible to be a value investor in software companies? Traditionally, growth investors have ruled the space. If you are not growing revenues (hopefully accelerating), the narrative you get is your company is a broken story that is likely on its way to irrelevance and is most likely a value trap or eventual take under… so the conventional thinking goes. However, over the years I have noticed commonalities amongst the software winners I’ve held and ones that did not pan out or became value traps. In the article below, I’d like to share with you how I think about software companies using a value oriented framework. These are tools and tricks that I’ve stolen from other people but I think are still underutilized and representative more of software investing than in other industries. The four core topics are:
- Intro: Understanding the Software Business Model
- A Framework for Margin of Safety in Software Stocks
- Underused Valuation Metrics
- The “Voss Sauce” of Software Value Investing
Intro: Understanding the Business Model
Software companies generally fall into one of two buckets when defining how they sell their software:
- Perpetual Licenses: The customer owns that version of the software, permanently. The key term here is “that version.” The strategy here is to release a new version of the software with so many important features that every 3-5 years that customers buys a new perpetual license. When I bought Microsoft Office, for instance, I owned that software forever, until I wanted to upgrade to a new version. As a general rule of thumb, software companies will sell a license that includes the first year of maintenance/support. After that, the customer often pays ~20% of the license as part of a recurring maintenance revenue. Generally in an enterprise setting maintenance is a required part of the perpetual contract.
- Subscription/Term Licenses: The customer is renting, not owning, the software, hence the buzzword SaaS, or Software as a Service. Usually a customer pays a fixed monthly or annual (or sometimes multi-year) subscription fee. Think of this type of service as “Netflix style.” You didn’t buy the DVD, you are paying for the right to view it over your subscription period. The big difference is that, embedded within the subscription fee is both the license and maintenance revenue, all rolled into one.
So which is better from an investor standpoint? If all things are equal (a huge if, discussed further below), I would prefer my company sell exclusively monthly or annual subscription services. There are two reasons for this:
- Modeling uncertainty: Licensing revenue is going to be lumpier and harder to predict, hence you will get more surprises and of greater magnitude. You will have to make more assumptions about how many old customers will upgrade to the newer version and replenish licenses. In my view it is harder to value perpetual license revenue, which would, all things equal, raise the cost of equity and lower intrinsic value.
- Lifetime value of customer is higher This is much more debatable, but again, all things equal, the NPV of a customer will be higher under a subscription model.
- Renewal costs lower This may sound counter-intuitive since you need more frequent renewals, but from my experience the bigger the upfront purchase (e.g. a new license), the more sales people and more expense that is involved, and often with monthly or annual subscriptions closing a renewal is rather simple and uncostly (and preferably won’t involve another sales commission).
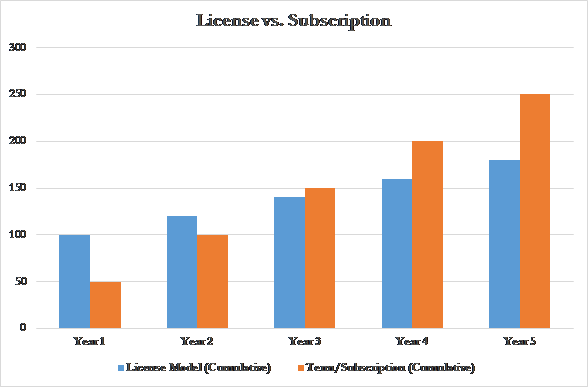
Let’s take an example where we assume that a company can either buy the software as a perpetual license for $100 and then pay $20/month in maintenance, or they can pay $50/year via subscription, which includes maintenance. As you can see, the cumulative lifetime revenue starts out higher with perpetual but by year 3 the subscription has cumulatively added more revenue:
Now those astute in finance know that cash in year one is actually more valuable than cash in year five. If we apply a 10% discount rate to all revenues, here is what we get:
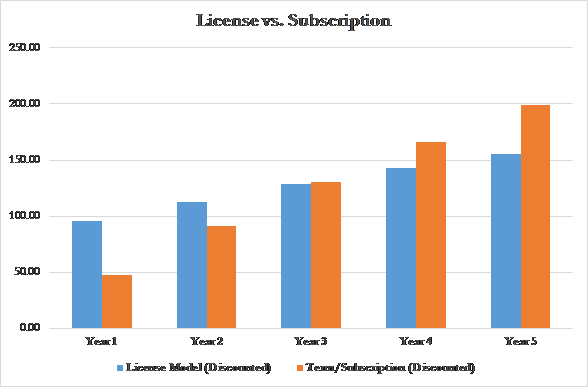
The picture is basically the same, but the spread tightens so that in year 3 it is equal and it’s only in year 4 that a real advantage to subscription occurs. Another way of looking at this analysis is that the two models, ceteris paribus, are basically equal if you assume that every three 3-4 years the customer will buy a new perpetual license.
In addition to license/subscription, there are basically two different ways to deploy the software:
- Cloud: This means all the information is being stored somewhere in a big data center, away from the company. If we are thinking in email terms, Gmail is a cloud email service. Cloud connotes that if you have a browser and internet, you can have access to the software (e.g. it doesn’t have to be installed on your laptop or desktop). From a cost/benefit analysis perspective, the cost of running the software (those big computers called servers) are generally paid for by the company selling the Cloud software.
- On Premise: This means the software is installed, stored, and run locally with on-premise hardware.
A common confusion point is that people equate SaaS/Subscription software with Cloud software. While most Cloud software does run on a subscription model, in reality there are plenty of companies that sell On Premise software via Subscription (e.g. Quorum, QIS CN. The opposite is rarer, it is hard to find many Cloud vendors who sell perpetual licenses).
A Framework for Margin of Safety in Software Stocks
I have a screen that immediately gets me interested in a software name:
- FCF positive/neutral
- Annual Customer retention >90%
- EV/ (Maintenance/SaaS Revenues) = < 2.0x
If the company is larger (e.g. $1 billion market cap and up), I’ll raise the EV/Maintenance Revenue ratio to 3.0x.
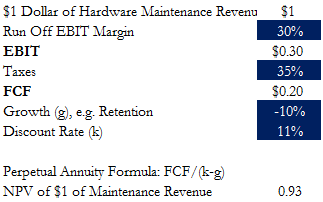
This is broad brush stuff. There are dozens of important caveats to this basic premise, but the general idea is that maintenance revenues are very high margin and relatively predictable in a run-off scenario. If the company is also FCF positive you know it at least has enough scale to likely be sustainable. You can use a modified annuity formula to come up with the implied value of each dollar of recurring revenue, as illustrated below:

If you buy a company that has shown itself capable of scale and being somewhat cost conscious (ergo FCF positive), at 2x recurring revenues, and 90%+ customer retention, in my view the bet starts to become asymmetric to the upside because a) often times the assumptions above prove to be conservative, especially 10% customer declines perpetually and a 35% tax rate b) additional unforeseen bad things will have less negative impact on the price than unforeseen good things having a positive impact c) there is greater likelihood the company will get bought out as the strategic EBIT margins will be higher from a buyer’s perspective. The incremental EBIT margin of high quality maintenance revenue is higher than 65%, generally (sometimes 85-90%) and thus attractive to an acquirer who could cut costs and fold the revenue into their existing support structure. It is very rare for a software company to get bought out for under 2x maintenance or SaaS revenues unless it’s hemorrhaging cash or has some other major problem (e.g. accounting or major customer concentration issues).
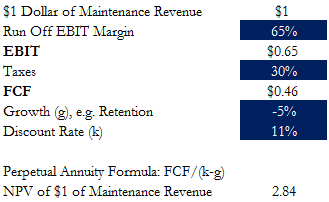
The above general equation is just a starting framework and each company is obviously unique. If the company’s long term effective tax rate is 30% and they can maintain a 65% run off margin and only lose 5% of their customers a year, you get this:
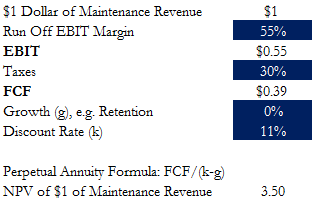
If the company needs to sacrifice some margin to maintain a 0% growth (more spent on renewals), it can result in a higher multiple as shown below:
Cost Structures and Run-Off Margins
As a Value analyst, a critical element is what an eventual runoff margin could be if the company chose that path. Running this exercise in nauseating detail is helpful because a) it helps you get a deeper understanding of the cost structure and b) it helps inform not only a downside but also how a Strategic (or Financial) acquirer might value the maintenance revenues. For each area, I am trying to get an idea of what is currently in the “growth” bucket and what is in the “maintenance” bucket as this can inform my eventual goal of figuring out run-off margins.
Cost of Goods Sold (COGS)
There are two very important things to figure out here: 1) what goes into the COGS line (on a cash basis, separate out any depreciation/amortization) and 2) what is the gross margin on maintenance/recurring.
You will want to find out what the company is putting into their COGS line. Ask specifically, “what costs go into your COGS line?” to find out, if it’s not explicitly laid out in the Q/K. What I would expect to find is the following:
- Hosting costs for cloud products
- Maintenance costs (e.g. support center plus other salaries geared towards support)
- Implementation costs
- Training costs
- Depreciation of capex, specifically if the company built server farms themselves
Ideally the company will break out their COGS by source, e.g. COGS for support, COGS for implementation. If not, this is a great question to ask. Specifically, you want to get a sense for the COGS on the recurring revenue. This gives you the underlying gross margin on the renewal business, and it should be quite high, ranging from 70%-90% for a good software company (rising higher as scale rises).
Gross margins (as an aggregate percentage) can be quite misleading. For instance, a company must often front lower margin implementation/training costs to get a customer up and running. Thus, a company that is doing gangbuster business may see a material decline in gross margins (again, as a percentage, not necessarily gross profit dollars unless implementations are a loss leader).
Sales & Marketing (S&M)
S&M might be the most challenging as there are so many elements to it. There is a fixed element to it (sales salaries), variable element (commissions), discretionary (marketing budget). Ideally you would like to get from management/IR the following:
- Breakout of Sales and marketing expense– sometimes never disclosed, sometimes only disclosed in the K. If management won’t give you exact data go back through the last few Ks to see if it’s disclosed, to get a sense of how consistent it is.
- Commission rates and structures– ask the company how they incentive their salespeople specifically. If it’s a perpetual license, do they get some percentage of that license and then some percentage of maintenance? Walk through a typical client buying the typical software first to understand what a salesperson receives.
- Renewals vs. new sales- especially important for subscription and term license deals is what the salesperson gets on an ongoing basis. I’ve heard vastly different things here. Some companies simply give the salesperson a piece of the original license sale, or a percentage of the first year’s subscription. Others get nice healthy checks simply by resigning a renewal or even for auto-renewals. This is actually critically important when considering runoff margins. If the company is paying the salesperson for renewals, it implies the renewal takes some effort and that retention is more challenging. Or, alternatively, the company is being run more for the employees than the shareholders. All things equal I prefer a divided sales structure, e.g. some part that focuses on new sales and a point where that client transfers over to a centralized renewal center. This structure gives me more clarity on what I could cut in a run-off scenario, plus seems more efficient.
- Non-direct channels- it’s important to know how sales made outside of direct, company owned sales people are handled. For instance, if you sell some of your software through a computer OEM sales team, how does that work its way through income statement? If the indirect channel gets a 30% cut of the license, is the revenue recorded as a net sale (meaning it will be higher margin because the cost of the OEM take is already accounted for) or a gross sale (meaning additional sales expense will be added).
You may hear many in the industry talk about Customer Acquisition Cost, or CAC, which is mostly some derivation of comparing S&M costs to new customer additions. This is then compared with the Lifetime Value of the Customer as a ratio to see if acquisition costs are used effectively, with the general school of thought being the LTV needs to be at least 3x as a high as the CAC for a healthy SaaS company. There are some good references on this here and here. While I think analyzing a company’s marketing spend and how it drives new sales is important, I find these metrics can suffer from false precision, as generally you are working with limited data and doing some guesswork, and the CAC can be distorted easily. For instance, a CAC could temporarily decline if the company is launching new products it intends to upsell and ramps S&M ahead of demand. I also view it as more relevant for growth investments than value investments. Nevertheless, this is an industry standard metric one should be familiar with when thinking about Sales and Marketing spend.
Growth bucket: new sales salaries/commissions, discretionary marketing dollars for new business
Maintenance bucket: sales salaries focused on retention, commissions on existing clients, mission critical marketing dollars designed for brand retention/renewals.
Research & Development (R&D)
R&D is the real “invested capital” when we are thinking about ROIC for most software companies. It is challenging in the sense that growth/maintenance/one-time is often not disclosed like an industrial might disclose maintenance vs. growth capex. It’s also a mistake to believe R&D can be hacked down in a run-off scenario too much.
- Capitalized R&D– the most common way I know of to manipulate EBITDA is to capitalize R&D vs. expensing it (well, that and stock comp). When comparing any two companies, it’s critical to normalize this factor when looking at EBITDA metrics. Also, if the company is reporting FCF but excluding capitalized R&D that is a red flag.
- Maintenance vs. Growth R&D– this is challenging to figure out, and usually not reported, but in some cases you can get a sense for the developer base that is covering current products vs. those covering new products. There may also be “one off” development work, particularly if the software company does customizations to their software, or if there is integration work being done to outside software parties
Growth bucket: new modules/projects to existing software meant to be cross-sold, one-off integration projects
Maintenance bucket: salaries for developers working on maintaining primary software
General & Administrative (G&A)
Unlike companies in other industries, software companies tend to separate Sales & Marketing from General & Administration, as opposed to the broader SG&A that most companies report. This can make screening on strictly G&A levels more challenging.
I view G&A at a good software company as the most fixed cost and the one that benefits the most from scale. A tiny software company may spend 20-30% of sales on G&A while a more mature midcap to large cap should probably target closer to 5%. Ultimately these costs include things like: upper management salaries, legal, accounting, human resources, travel, corporate development/treasury, and potentially rent for leased office space. Since this can cover a broad spectrum of things, it’s important to get an idea of what is there. For companies that grew a lot early and then slowed, there can often be a lot of fat here that could be cut in a run off situation.
- Management salaries and total comp- generally the most egregious spending will be management paying themselves, so try and bucket this off. In a runoff situation or acquisitions by a strategic buyer a lot of these costs can be cut down.
- Historical analysis- one thing I like to do is look at the absolute level of G&A over time. As mentioned, most of these costs are fixed and should be growing much more slowly than the company is growing, and can serve as a reference point as to what the company could get back to if it needed.
- Takeout analysis- this is one place where takeout analysis diverges from run-off analysis. In a runoff, most G&A costs may need to be kept. However, in a takeout, this is where the largest redundancies are located. Therefore, in a runoff analysis you want to be a bit more conservative in what you can cut from G&A (especially if it’s at or above comps for its size), while in a takeout scenario analysis you can probably safely cut a bit more.
Growth bucket: HR additions, senior level management salaries, some rent expenses
Maintenance bucket: Most rent, some management expense, technology (ERP) expenses
Free Cash Flow
There’s been times someone has come to me with a software idea claiming it is growing 30% and trades at 3x recurring revenues. Upon inspection, while the person is not making the numbers up, a murkier story emerges when I see the cash burn and numerous equity raises over the years. A company that is FCF positive (or at least has been FCF positive in its recent, current state) shows me that they not only can achieve scale and that the they have a real business, but also that management is acting responsibly and managing the company’s money like it’s their own and not engaging in the RGAAC (Revenue Growth At All Costs) strategy or Empire Building strategy.
We can have intelligent debates about cash burn. If the company’s market opportunity set is available it may in fact be the right call for them to burn cash in the short run to acquire customers, build new products, and expand operations. The problem is, I need to know so much more about the growth opportunities and visibility of said opportunities to get comfortable with the cash burn, or trust management so intrinsically (very rare), that I generally dismiss a company from my value investor universe that is actively burning cash and wants to continue to “invest in growth” (code for burn cash). I prefer companies that can self-fund their own growth and have shown a history of at least breaking even. I may miss out on some true home runs by sticking with this methodology, but I also feel more secure about the Enterprise Value I am working with and can more reliably get a sense for true downside.
Questions to ask yourself:
- Has this company ever been cash flow positive? Go back and check their history since inception and see.
- If it was before and is not now, what changed? Did R&D go up (maybe salvageable, possibly more discretionary in nature) or are they spending more on sales & marketing (less compelling, potentially trying to throw more money at the problem to keep revenue up)? Have gross margins declined (indicative of price cuts)?
- Cash flow quality questions:
- Is the company generating FCF simply by signing longer term contracts and getting cash upfront? While this does have some positive attributes, check to make sure the long term deferred revenue balance is not spiking relative to overall deferred revenues. It may mean they are signing longer term contracts at worse terms just to show strong billings that will not be sustainable.
- Billings equals revenue+ change in deferred revenues.
- Is the company hiding any cash costs in traditional FCF calculation? Make sure there aren’t any funny items in the Cash Flow from Investing items (like R&D capitalization that they are excluding from their capex, or “intangible acquisition”) or Cash Flow from Financing (lease payments). Capitalized R&D is by far the most common “trick” to show a higher EBITDA and really needs to be normalized across companies (or just use EV/EBIT). Sometimes capitalized R&D is legit, as it really is more like “growth capex” rather than maintenance capex, but some companies capitalize practically all their R&D.
- Is the company generating FCF simply by doling out excessive stock comp? If stock comp expense is above 5% of sales I start dinging the company on any cash it’s actually generating. To be conservative, I ex-out normalized stock comp grants from the FCF.
- Is the company generating FCF simply by signing longer term contracts and getting cash upfront? While this does have some positive attributes, check to make sure the long term deferred revenue balance is not spiking relative to overall deferred revenues. It may mean they are signing longer term contracts at worse terms just to show strong billings that will not be sustainable.
Customer Retention
It is important for me to understand the long term historical churn of customers, the primary reasons for churn, and the steps/costs needed to maintain current churn. A company that does not explicitly report its retention numbers (both customer and dollar retention) or at least verbally give updates on a retention framework is generally crossed off my list. If the retention was great, they would probably report it.
It’s also very important to understand the most common reasons for churn. Know that management will almost never admit to any competitive losses or people just leaving their product. Instead they will blame the following: sales team reorganization causing renewal delays, industry consolidation, and customers going out of business.
Even when reported, churn can be a very tricky number to interpret and get confidence in, as there are numerous ways to distort it. For instance, you can maintain a customer by charging them 50% less. Or, maybe you have 95% customer retention but you lose a customer that represents 20% of revenues.
Generally, I’m willing to award a higher “g” value (growth in DCF/run-off analysis) if I can see a history of customer churn, along with revenue retention (e.g. or average revenue per user, or ARPU). Ideally, I get a history going back to the last recession, as I want to understand how recessions hit the company, but sometimes this simply is not possible.
Customer concentration is trickier, as there are two (inherently contradicting) rules of thumb:
- High concentration in a few customers is riskier, obviously, but probably less costly to renew and support (unless those customers are mega cap behemoths that demand excess resources).
- Extremely low concentration is less risky, but likely will result in greater costs to maintain.
The perfect company is somewhere in the middle, selling to businesses (rather than to consumers), where no company is more than 10% of revenues, but the number of customers is manageable and supportable at a reasonable cost. For consumer facing businesses I will be inclined to lower my run off EBIT margin assumptions, all things equal.
It’s important to get a thorough understanding of the costs that go into maintaining and keeping a customer. Some questions to get a handle on:
- How does support work? Is there a centralized support center, or does support staff need to go to the customer’s site on occasion? What is the current capacity utilization of the support staff? In an ideal world, there is a very low rate of calling by customers needing support, but the support is critical enough that customers will still pay for it. It’s important to understand the fixed versus variable cost element here. If the customer base drops 10%, do you still need pay the same number of workers to support, or can you slim down and keep the margin?
- How does contract renewal work? Is there a sales process or is it automatically renewed until canceled? If there is a new “bake off” every time a renewal comes up, costs to maintain the customer will be higher. Do salespeople get commissioned on renewals (preferably not)? I prefer shorter contracts that automatically renew unless the customer steps in and cancels (assuming high switching costs and the software is mission critical), preferably with automatic price escalators over time (e.g. tied to CPI).
- What are the switching costs? Obviously if the software is complicated and employees use it all the time, there is major pain in switching to a new platform (e.g. call it the Excel Effect for us financial analysts).
- How mission critical is the software? If it goes down can the company function? ERP is critical. Data analytics maybe less so.
- How much does the software cost compared to the competition? If it’s priced at a premium, potential churn is higher. If it’s 50% cheaper than competitors already, that threat is mitigated somewhat.
All these questions can help you answer what a good churn value can be, and also help assist in getting to a reasonable runoff margin on maintenance revenues.
A Note on Recurring Revenues
“Recurring revenues” seems to be the new buzzword any company (not just software/tech) likes to throw into their investor presentations. Recurring revenues are theoretically attractive because they should provide more revenue stability, but the first thing I do when I hear that a company is “70% recurring” is find out exactly what they mean by that. Every dollar of “recurring” revenue is not equal.
The two biggest games people play with recurring revenues are:
- Classifying lower margin contracted revenues as “recurring” (e.g. hardware maintenance or other contracts).
- Classifying non-fixed revenue as recurring.
For #1, I don’t have any issue with this type of recurring revenue. It is generally stable, and usually somewhat profitable, but it simply won’t have the 60%+ run off EBIT margins that higher margin software maintenance or SaaS revenue will have. Generally, I have seen this type of revenue come in closer at 25-30% gross margin. Thus, while the consistency may be there, it needs to be valued differently since the peak operating margin will be so much lower. Using our original framework, it could look something like this:
For #2, the biggest potential issue is if the customer is being charged based on usage or transactions. For example, outside of the tech arena, a company I spoke with that collects garbage for corporations considered that revenue recurring because they had signed a two-year contract that was volume based. However, a lot of the revenue was also based on the price of metals (e.g. scrap steel) and could deviate significantly. Some Health Care IT names and Payment Processors have a transaction charging model. One of my favorite business models, fund administration companies (e.g. stocks like SSNC), charge based on Assets Under Administration, which can fluctuate with asset prices while still being contractually recurring.
Neither of these two issues are deal breakers, it’s just important to understand the quality and volatility of the “recurring revenue” before giving them high run off margins and low churn.
Valuation Multiples for Software Stocks
I employ three different valuation techniques that I believe are beyond the mainstream stock screening criteria. Some stocks are less prone to be valued in this way than others, and some benefit from using all three:
- EV/Software Recurring
- EV/Gross Profit
- EV/(Funds from Operations-Capex)
EV/Software Recurring
As discussed, I think this can be more effective than simply using EV/Sales as a baseline. This valuation method is best employed when either the company has most of its revenue as software recurring (either maintenance or SaaS), or to derive a margin of safety. As described above, even smaller companies should at least maintain a 2.0x ratio here if they have shown some level of profitability and have a reasonably stable customer base.
Sell side analysts do use this on occasion, but tend to stick with EV/Sales.
One notable exception is John Difucci from Jefferies. Every Friday he publishes a comp table showing his estimate of what software stocks are trading at, EV/Software Recurring wise. In his opinion, a company should trade closer to at least 4-5x its maintenance/SaaS revenues, although he is generally dealing with larger companies with superior scale. I find this analysis helpful as he has gone through the 90+ companies in his universe and pinpointed their maintenance revenue base. Of these 90 companies, the median EV/Software Recurring is 6.6x and the average 7.8x. Only six are below 2x and a quick scan of those reveals they have some major structural challenges.
EV/Gross Profit
Gross profit is a nice way to normalize companies that have a mix of software, hardware, and service revenues. A lot of vertical niche software companies will also sell hardware with the software package, usually at lower margins, which can make using an EV/Sales ratio challenging since a lot of those sales are of lower quality. A company with a lot of hardware and service revenue may look expensive on an EV/Software Recurring because one has not given any value to the other revenue streams.
EV/Gross Profit is a nice middle ground between EV/Sales and EV/EBITDA, assuming the company is categorizing its COGS correctly. This can be problematic, as some companies put amortization of intangibles into their COGS, or depreciation, while others do not. Some companies dump some of their R&D and S&M into COGS, while others do not. This needs to be normalized when comparing relative EV/Gross Profit valuations. Scanning the entire United States Technology landscape, the median EV/Gross Profit is about 6x, so when I look at this metric I look for any company below 3x as “interesting.”
EV/(Funds from Operations-Capex+Normalized Cash Interest +-Normalized Taxes)
This is fundamentally the same as EV/unlevered FCF except it is adding back changes in working capital and then applying the long-term tax rate to the company. I find it to be slightly more telling than traditional unlevered FCF as a measure, as it removes what are sometimes volatile swings in working capital and sometimes normalizes a company that has pronounced seasonality in its Account Receivables and Deferred Revenues.
It’s important to note here that you want to monitor normal working capital ratios like DSO (Days Sales Outstanding) and DSDR (Days Sales of Deferred Revenues). If A/Rs are swelling or Deferred Revenues are collapsing there could be other problems going on with the company that this metric will not catch.
I would note this ratio is also less important for faster growing SaaS companies, as the true business momentum of the company needs to include growth in deferred revenues (e.g. Billings which is revenue+ change in deferred revenues). For a company with low to no growth that is focusing on profitability and cost cutting, however, this is a solid way to capture true improvements. It can be compared to Adjusted EBITDA and Adjusted EBITDA-Capex and if there are large directional discrepancies (e.g. Adjusted EBITDA is improving much faster than this metric) it is a potential flag that EBITDA is being distorted.
The Voss Sauce of Software Value Investing
The dream of any value oriented software investor is that ultimately fundamentals improve enough that growth and more neutral investors begin to pile in. This is a rare occurrence, but when it does happen it can result in incredible returns. The largest outsized returns occur when both revenue growth accelerates (sometimes from negative to positive) along with rising margins. While it’s hard for me to empirically prove this, I believe there is something very psychologically pleasing to hold a stock that is improving both revenue growth and overall margins. People, rightly or wrongly, begin to extrapolate these improvements into the future (just like they were extrapolating the negative trends previously). Even if it’s simple optics and perhaps not sustainable, these two things in concert will rarely result in material underperformance.
The way I look for these situations is primarily asset divestitures combined with management/board changes. This signals to me that there is a change in thinking, and rather than going down the route of Empire Building the company is attempting to maximize shareholder value.
Once you spot a struggling value software company divesting assets, two additional criteria are important to note:
- Make sure the asset being divested is the worse asset, not the better one, as when one sells the better asset it signals more desperation to me than a sustainable change in value creation thinking (HHS as a recent example)
- Make sure the company is reasonably financially healthy (as in not about to go bankrupt) without the asset sale. Sometimes a company will “burn the furniture to heat the house” and that’s not what we are looking for here.
A divestiture does a couple things that I find attractive. One, it simplifies the story. Ideally the company moves from a multi-segment business to a “pure play” which almost always garners a higher multiple in the public market. Two, it temporarily makes the optics look worse for the company while setting it up to look a lot better in 12-18 months. A casual glance of that company will show revenue declines and sometimes lower profitability (depending on how much of an albatross the divested asset is, there will sometimes be unallocated corporate costs that the asset was sucking up, or perhaps some severance costs), causing almost all screens/investors to overlook it. However, once the noise clears up, in theory you should have a better asset (hopefully growing), stronger management focus on that single asset, and improved profitability (assuming the divestiture was weighing on profitability).
If the company is holding a “gem” asset that is growing materially, the divestiture can result in the Voss Sauce of technology investing: accelerating revenue growth and rising margins concurrently. I believe this improvement in fundamentals will also increase the likelihood that the company gets bought out, as it’s now “cleaner” and easier to analyze for a potential strategic acquirer.
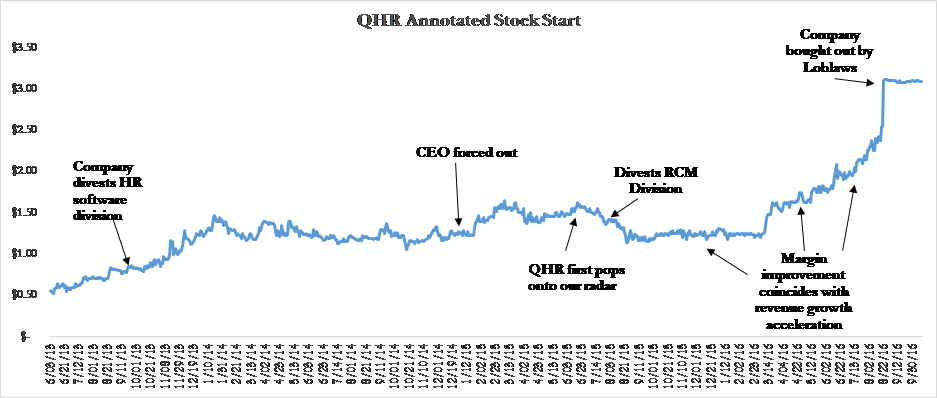
Example 1: QHR Corporation (QHR.v, Canada)
QHR Corporation is a leading provider of Electronic Medical Records (EMR) in Canada. 90% of its revenue are “recurring” and we assessed them as very high quality recurring as they were monthly subscription fees charged to doctors who used them as mission critical software. They reported churn of 2% of less, were growing their doctor base, and the gross margins on recurring revenue were about 90%.
They popped onto our radar in mid-2015 when we noticed they were trading in around 2.25x recurring revenues (3.5x gross profit), had forced their CEO out, were marginally cash flow positive, and had made a major divestiture in late 2013. The stock had stagnated from being a high flying growth stock into more core/value territory. However, we did not immediately buy the name because profitability was still being plagued by another problem asset, a Revenue Cycle Management business in the United States that was hurting their cash flow numbers.
In mid-2015 they began to suggest being open to selling that problem asset, and we got very interested in the company in July, 2015, when they formally announced they had sold the RCM division. At that point they were a full-fledged EMR pure play in a consolidating industry with strong underlying characteristics.
After digging in on the company, we believed margin improvement was imminent (given management’s focus on improving margins and guidance on cash flow improvements) given the noise surrounding the divestitures and a slight dent in profitability from a tuck in acquisition related to the EMR business. We also estimated that at the very least revenue growth could stay in the 15-20% range for the next few years and could potentially accelerate.
What is interesting in observing the stock chart below is that the market did not immediately react to this. Profitability still looked stunted, and there was some hand waving about the new CEO and how large the growth runway really was. In our minds, management (along with an activist investor, Pender Funds, who had board seats) had realized that slimming down and focusing on their EMR opportunity in Canada was the way to go, and we approved. We felt buying the stock at close to 2x the annual recurring revenue run rate, with recurring revenues growing 20% and profitability forecasted to improve, made the bet asymmetric. We also believed, although it was not a part of the core thesis, that this evolution to a pure play made it materially more likely a strategic would get interested in the company.
This stock hit nearly all our check boxes:
- 25x Recurring Revenue and 3.5x Gross profits
- FCF positive
- Asset divestitures fully completed, with new management team
- High quality business with low churn
- Material chance to accelerate both revenue growth and profitability concurrently
Example 2: Merge (MRGE)
Merge is another Healthcare IT stock that sells a mix of software, hardware, and services but focuses on radiology as a niche. It had a series of negative fundamental and idiosyncratic developments that pushed it to 1.7x sales, 3x maintenance, and 3.5x gross profit in the beginning of the 2014 when we began to get interested. License and hardware sales went into negative growth as the adoption of ICD-10 (new billing coding) slowed down sales cycles. The company had an incident where a rogue company falsified a few million in billings, they removed the CEO, and the company’s debt got dangerously close to breaking covenants.
New management with a track record for operational turnarounds was brought in and we were immediately impressed with their new focus on paying down debt and improving margins (nothing like a brush with breaking covenants to inspire focus). While they did not specifically divest businesses, they did get out of selling certain types of hardware which were money losing for them, and seemed to take a holistic view towards cost cutting while still recognizing and investing in their best assets. In addition, we felt they had two “gem” call option assets (one was a clinical trial software platform that competes with Medidata, and one was an imaging interoperability initiative to drive availability of radiology exams between hospitals). We believed, based on the slight cyclicality of the business and clear reasons for slowdown, that both growth would return in time and that margins could improve material, making the bet asymmetric. We also believed the optics would improve materially as much of the revenue declines were coming from getting out of the low margin hardware business.
It was pretty clear that if the company just executed marginally, there would be a 3-4 quarter period of the Voss Magic Formula for technology stocks, rising margins concurrent with improving revenue growth, which is what happened (shown below):

From Q1, 2014, to Q4, 2014, EBITDA margins improved over 200 bps while growth went from -20% to flat.
What is interesting, and perhaps encouraging for future investments, is that there was plenty of time to get into the stock even though fundamentals clearly improved materially in Q2, 2014 (with margins improving even before that). For a few frustrating months, we felt the thesis was playing out but the stock was not reacting. A lesson for these value based forgotten stocks, though, is that sometimes it will take a few quarters of sustained execution before the market regains trust in the company. Once that happens, outperformance can commence.
About The Author: Travis Cocke
Travis Cocke is the Portfolio Manager of the Voss Value Fund, LP. Prior to founding Voss Capital LLC in 2011, he was a Portfolio Manager at Farney Management Corp., a family office in Georgetown, Texas, and Analyst at Ascendant Advisors LLC, in Houston, Texas. Mr. Cocke joined Ascendant as a generalist research analyst. Mr. Cocke received a BBA in Finance from Texas A&M University. Mr. Cocke was awarded third place in the inaugural SumZero investment idea contest in summer of 2013, first place in the 2015 FactSet Best Large Cap Idea contest, and “Judges’ Top Pick” for the best investment idea for the Pitch Perfect contest at the 2014 Texas Hedge Fund Conference.
More posts by Travis Cocke