Discovery Holdings: A Two-Year Research Project Culminating in a New Investment

February 2, 2019 in Africa, Equities, Financials, Ideas, Ideaweek, Letters

This article is authored by Ideaweek and Zurich Project participant David Eborall, Managing Director of SaltLight Capital, based in Johannesburg, South Africa.

Discovery Holdings is a financial services company that successfully uses behavioural economics to change customer behaviour (be healthier, drive better and, soon, be a better credit risk). The company is slowly integrating its data platform into some of the world’s largest insurers, such as John Hancock, AIG, and Ping An. Discovery is gathering a vast database on their customers’ health, what they eat, where they drive, how they drive, and, in the near term, what they spend their money on. Investors often talk about Kahneman and Cialdini in their investment processes; Discovery is actually using those principles to change behaviour.

Discovery is a two-year research project culminating in a new investment. Briefly, the overarching investment thesis is that Discovery is ‘closing the loop’ as a consumer aggregator in financial services and will continue in enhancing their customer’s lives through digital measurement + behavioural change.

Discovery offers ‘commoditised’ medical, life and P&C insurance products to their four million domestic and international customers. Within a few months they will be launching a banking platform. Some market participants think this venture is likely to sink the ship in a very competitive banking market.

It is my opinion that Discovery knows more about their customers than any other technology company I can think of – even Google or Facebook.

Let’s compare Google and Discovery: Google has a considerable advantage around knowing who you are and how likely it is that you will click on an advert.

Discovery knows what a customer eats, when they exercise, what their health issues are and is even experimenting with collecting DNA[1].

It would seem unconscionable that Facebook or Google would have such detailed information about their users. Yet, Discovery’s customers willingly provide their health records, their driving behaviour, their food purchases and, in a short time, a full picture of their spending habits.

It seems that by providing ‘earned’ incentives, customers are less likely to have qualms about privacy.

Strategically, Discovery has mimicked Apple’s integrated architecture playbook rather successfully. Clayton Christensen notoriously advanced the theory that excess profits are made in an interdependent product architecture[2].

An example would be helpful: Apple has created considerable customer switching costs by designing an integrated product architecture between disparate products (say a watch and a phone) with the addition of a ‘services’ layer (the Apple App Store) on top of their products. The App Store creates network effects that binds third- party developers and multiple devices together with Apple’s customers – continuously growing the value of being an Apple customer as one adds each device and each app.

Discovery similarly integrates and differentiates their products with an ‘incentive’ layer on top. The incentive layer, called Vitality, interlinks the various financial services products and is the ‘secret sauce’ to lower lapse rates and lower overall insurance claims.

Most insurers are passive observers of their customer’s lifestyle habits. At best, they manage anti-selection risk and avoid ‘sickly’ customers through pricing. Vitality uses modern behavioural finance techniques[3] as a ‘carrot’ and ‘stick’ to actively change behaviour. Customers are incentivised to be more active, drive more carefully and save more for retirement. These activities reduce the insurance claims down the line and Discovery ‘shares’ the saving with their customers.

More beneficially to customers over the long term (if a Vitality member meets their goals on physical activity, routine tests and adherence to programmes) management indicates that those who use the Vitality product are likely to add years to their life[4].

Mortality Bent Curve (by Vitality Status)[5]

A Widening Moat

Discovery has two elements that create a formidable moat: (1) the best ‘marshmallows’ and (2) better data leading to better pricing.

The best ‘marshmallows’

Discovery’s insurance products are as much as a ‘grudge purchase’ as any other. In my discussions with customers, there are more than a few that would love to leave Discovery – yet they don’t. “Why not?”, I ask. Customer response: “oh, they give me 30% off flights” and “I’d lose my gym discount”.

Discovery seems to have successfully tapped into the depths of the human psyche by giving customers the best Marshmallows[6] (flights, coffee, discounted gym memberships etc) resulting in suppliers (including medical practitioners) being forced to follow them. Discovery subsidises 1m flights per year (22 planes per day) and 70,000 gym visits per day. Customers forgive Discovery despite have a reputation of being tight-fisted in paying claims.

Benefits like these are, theoretically, easy to replicate – competitors should simply be able to buy them. However, in reality, competitors are severely disadvantaged. With a 40% share of the private medical insurance market, no competitor has been able to match (on a per unit benefit cost basis) Discover’s benefit range. Discovery has contractually locked up the most- desired consumer-incentive suppliers (airlines, gym brands, coffee chains and healthy gear) by being early but also by providing significant market power.

Therefore, competitors are always at a price and value disadvantage to replicate the same benefits. This has created a positive feedback loop where Discovery directs more customers to a supplier, which means better terms (more transferred value and lower pricing), which, in turn, means more customers.

The result: Discovery’s supplier advantage has forced many competitors to capitulate and rather compete on distribution or other factors.

Better data leading to better pricing

If ‘Big Data’ is the new moat, Discovery is years ahead of its one-dimensional competitors. Most life insurers price their life insurance products using standard actuarial life tables with some idiosyncratic adjustments (smoking or demographic factors) to account for an estimated mortality. Discovery has a substantially wider data advantage to pin-point an individual’s life expectancy and other behavioural tendencies with superior accuracy[7].

This ‘commoditised product’ + ‘differentiated layer’ strategy has been rolled out in each product segment that Discovery has entered into (retirement products, short-term insurance and, in the future, banking).

Why go into banking?

The purpose of starting a bank is to (1) know where/how a customer is spending their money and (2) grab more share of a customer’s wallet. As with health data, Discovery is likely to utilise this data to change a customer’s spending and savings behaviour.

Discovery is already deducting points if a customer puts a chocolate rather than a lettuce in their shopping basket. I speculate a scenario where their app deducts points if you haven’t saved ‘x’ in a particular month?

Discovery’s banking initiatives come with significant risks as the South African banking sector has extremely high barriers to entry. The ‘benign oligopoly’ that has existed for decades is unlikely to easily allow new entrants. Discovery’s target market is the middle to upper income cohorts – the ‘bread and butter’ of the stodgy oligopolistic incumbents. History has shown that, in the last two decades, the only new entrants that have succeeded have targeted the ‘unbanked’.

So why could Discovery possibly succeed?

Think back to Apple. Apple succeeds because of its integrated product eco- system. The value of a customer’s individual products become more valuable as each new product (Watch, iPad) is added to the platform. The differentiating layer (the App Store) binds these pieces together. Similarly, Discovery has followed this same process. The medical insurance market in the early 2000s had major incumbents offering a commoditised product. Two decades later and Discovery has 40% market share of the private medical market because they offered a ‘differentiated layer’ (Vitality) on top of a commoditised product.

By creating an integrated solution, customers accumulate more value by moving across to Discovery’s commoditised products. The sum of value is greater than the parts[8].

Furthermore, given that banking products have a smaller absolute cost than insurance products, it makes strategic sense to use a banking product as a ‘gateway’ product that could be leveraged to encourage non- customers to buy other Discovery products.

These competitive advantages raise my view of their odds of success with a significant ‘market-share grab’ opportunity[9].

Members, log in below to access the restricted content.

Not a member?

Thank you for your interest.  Please note that MOI Global is closed to new members at this time. If you would like to join the waiting list, complete the following form:

[1] Source: https://www.humanlongevity.com
[2] Theory of Interdependence and Modularity: The Innovator’s Solution, Clayton Christensen (chapter 5)
[3] Daniel Ariely is a consultant to Discovery (link) and much of his work has been implemented in changing customer behaviour.
[4] Source: Company: After 10 years on Vitality, average reduction in mortality is 16%
[5] Source: Company: The reduction in mortality (actuarially expressed as the probability of death) by age 65 is significant on the highest levels (gold status) of activity. The lower the value on the y-axis, the lower the probability of mortality.
[6] Marshmallow Test: https://en.wikipedia.org/wiki/Stanford_marshmallow_experiment
[7] For example, based on their data, there is a high correlation to indicate that healthier people are a better credit risk (if you’re disciplined enough to go to a gym three times a week, you’re likely to be more disciplined in paying your bills).
[8] For example: A discovery health customer obtains a larger discount on a flight purchase if they use a Discovery Credit Card to pay for it.
[9] Most banks have their own loyalty products however they are significantly inferior in isolation. Furthermore, they lack the smooth integration that Discovery has.

Let Them Cheat

February 2, 2019 in John's Blog

Herd mentality is everywhere.

We know it well in investing. The exuberance or fear of fellow market participants is contagious, and only the most independent-minded investors are able to resist the pull of the herd. The latter is so strong that clear-thinking investors are often called “contrarian” even though they are simply unaffected by the crowd.

Herd mentality prevails not only when it comes to investment decisions but also investment business decisions — how a manager structures fees, treats clients, exploits loopholes in the law and, yes, cheats. High-frequency trading, market manipulation, spreading of false rumors, trading on inside information are examples. In some market environments there are more cheaters than in others, not because the participants have changed, but because the herd has come to consider a questionable practice to be “how things are done these days”. Those who refuse to go along have to accept the possibility of being left behind.

The urge to follow the herd is perhaps strongest in the world of sports, particularly in disciplines in which pure speed or endurance determines success. In those sports, luck plays a smaller role than in multi-factor, low sample-size (i.e., low-scoring) sports such as soccer.

In cycling’s era of Lance Armstrong many otherwise honest athletes were sucked into cheating because doping was the open secret — it was illegal but perhaps perceived as not entirely wrong because seemingly everyone was doing it. It’s not hard to imagine the predicament of a competitive, goal-oriented cyclist of Armstrong’s generation. Without doping, he did not have a fair shot at beating Armstrong and the other dopers. In the athlete’s mind, he had to choose “unfair” over “illegal”. That’s a tough choice.

One athlete made the choice to put himself at a disadvantage. He stayed clean in a sport in which pure speed is everything:

Bolt’s success is impressive for its sheer record-breaking nature. It’s even more impressive for the way in which Bolt achieved it. The above table shows the fastest 100-meter sprints of all time, with the names of dopers crossed out. The other names are all “Usain BOLT”.

Investing is not about raw brainpower. It is not about who crunches more numbers, talks to more people, or gets more “scoops”. It is to a large degree about judgment, a long-term orientation and, yes, luck.

In such a field, resisting the pull of the herd should be considerably easier than it was for Bolt. We need to stop being afraid to look silly.

Prepare to be wrong and alone occasionally. The rewards are long-term outperformance and, perhaps more importantly, the knowledge that you stayed true to your convictions.

Multiple Fears Converge

February 1, 2019 in Ideas, Letters

This article is excerpted from a letter by MOI Global instructor Patrick Brennan, founder and portfolio manager of Brennan Asset Management, based in Napa, California

Many of the various macro concerns discussed in previous letters converged during the fourth quarter and created a powerful vortex of selling pressure that pummeled most asset classes. Year-end tax loss selling further fueled the storm’s strength and the S&P 500 declined -13.5% during the fourth quarter, including a -9% decline during December. Trade war and interest rate concerns, first concerns about higher rates…then fears of yield curve inversion, account for some of the anxiety. That said, we think the biggest worries centered around global economic weakening and whether a recession was about to emerge in China or Europe and whether this recession might quickly spread to the United States. Despite concerns about a more fragile US growth outlook, Federal Reserve commentary was more hawkish than some would have liked and created another round of selling. With risk-free cash finally earning above 2 percent, many concluded that a long economic expansion/stock market rally was ending. Copying the behavior of sports fans who empty stadiums to avoid traffic midway through the fourth quarter (or halftime in the case of Notre Dame fans watching the Cotton Bowl carnage), investors decided to exit before feared negative economic prints became visible.

So, what’s next? Will stocks keep going down or will the market bounce back? Are we about to enter a recession? In past letters we’ve rhetorically repeated these common questions and essentially answered: “We don’t know.” Unfortunately, we still haven’t found the magic crystal ball which will provide answers. Of course, we remain suspicious that one even exists. In our Q1 2016 letter, a time when similar recession worries surfaced and a time when many prognosticators noted the unsustainable length of the current expansion, we described a study by two IMF researchers[1] who found that professional forecasters had picked only 2 of 60 recessions one year in advance during the 1990’s. The same group was essentially perfect in its inability to predict the 2008/2009 recessions one year in advance. If this group — likely armed with sophisticated econometric models and closely monitoring every macro data point — struggles, we find it difficult to believe that we (or most other investors) would do much better. Despite this, we find this exact topic is among the most frequently discussed by many investment professionals. The conversation vaguely resembles discussions among a group of weekend warriors where the “glory day” amateurs describe the best way to guard basketball star James Harden in a game of one-one-one…after watching him torch fellow professional Klay Thompson for 50 points. Economic expansions end at some point, and there will be another recession. But, we still think it is impossible to know the timing.

Cheap Gets Cheaper

Moving away from sports analogies and moving from the macro to micro, our portfolio struggled during 2018. We own a small number of names that we viewed as statistically cheap prior to the fourth quarter rout. While several names initially held up better than the overall market, this resilience quickly faded and these inexpensive and illiquid names often declined more than the overall market. Towards the end of December, tax loss selling and/or fund liquidations caused even sharper declines and several holdings dramatically diverged from any reasonable estimate of fair value.

We take a longer-term view on any investment, generally looking to own names for 3-5-year periods and often longer. Normally, it takes time for price and fair value to converge and often the gap widens before narrowing. Having invested throughout 2008/2009, we certainly appreciate the fact that cheap often becomes far cheaper than expected. We also understand the frustration that comes from the recent declines and near-term underperformance. That said, we do think there is substantial upside in our portfolio, although we acknowledge it is difficult to predict the exact time when this value will be recognized. Certainly, not all of our holdings will play out as anticipated. We have made errors in the past and will do so again in the future. That said, we think at least a couple of our holdings can generate substantial returns which carry the entire portfolio, given our higher position weightings.

In past letters, we have provided a more in-depth profile of a holding. As we’ve continued buying many of the same names discussed in past letters, we thought it would be helpful to update several of our largest holdings and to quickly summarize our investment rationale. For those who want the simplest summary, we would simply say that little has changed from past letters, that the declines have widened the price to intrinsic value gap and this recent underperformance represents a great time to add money, notwithstanding the likely continued volatility in the months ahead.

We will divide the summary into 3 categories: cable, financial service and consumer discretionary names. While there are nuances to these investments, we would note some broadly common themes:

  • Recurring customers/cash flow
  • Complicated (and often leveraged) capital structures
  • Strong management teams
  • Large capital returns (generally buybacks)

Certainly, not all these characterizations apply to every holding. Additionally, several of the largest holdings are either based or operate outside the United States and are exposed to FX movements. When the dollar is strong (as has been the case over the past couple of years), this has been a headwind as overseas markets have generally underperformed US markets. Furthermore, multiple names (LBTYA, KW, TSB) have sizeable exposure to UK/Ireland and are therefore viewed as more susceptible to Brexit uncertainty. As we’ve noted in past letters, the Liberty names and private equity names are often difficult for multiple classes of investors to own. Several of our holdings would be considered smaller or mid-cap companies, but their effective tradable float is even smaller, given larger insider ownership and often concentrated ownership among a small group of institutions. This smaller float makes these names more exposed to the types of extreme movements experienced during the fourth quarter. Finally, but we believe most importantly, the names below appear inexpensive on a relative and absolute basis. So, to summarize, our names are good businesses, with many operating outside the US, but are often less liquid and often viewed as “risk off” stocks – i.e., the exact opposite of what investors wanted to own in Q4 2018. We see upside as described below:

Recession-Resistant Cable Names

If an investor were convinced that a recession was approaching and he or she had to own stocks, utilities and consumer staple names have traditionally been considered safe havens (rightly or wrongly). We’ve long discussed how cable looks like something closer to an unregulated utility. If we simply plotted cable cash flow over the past 15 years and provided no time markers, it would be difficult to pinpoint when a recession begins or ends based only on cable’s operating results. While we would concede that some consumers may consider downgrading internet speeds if times really get tough, we still suspect the internet connection ranks close to electricity/water/brand-name diapers in the pecking order of last items standing during a recession. While video cord cutting may accelerate, we think consumers will continue to need broadband as they consume more data. We own US, European and Latin American cable through four names.

GCI Liberty (GLIBA)/Liberty Broadband (LRBDK): We think Charter (CHTR) has the strongest operating/capital management team and we see a path for the roughly $290 stock to eventually produce $30+ in free cash flow per share (FCPS). We own the name through two Liberty vehicles trading at 10-20 percent discounts. Compared to international peers, US cable companies face weaker competition for broadband subscribers, and therefore the visibility on cash flow is probably highest relative to our other cable names. While CHTR does trade at a premium to other cable names, we receive a roughly 15 percent discount through our LBRDK/GLIBA holdings. As discussed in past letters, we think the 5G risk is very manageable. We acknowledge that there is regulatory risk and certainly concede President Elizabeth Warren (…gulp) would not be good for cable stocks. But, we also believe that investors are underestimating cable’s mobile opportunity. Furthermore, CHTR will likely repurchase a large portion of its share base over the coming years. To the extent that the price doesn’t move, the per share economics get even more attractive, especially considering the large amount of cheap debt financing fixed for the next ~10 years. It is highly likely that we will ultimately receive CHTR shares for our stake in LBRDK/GLIBA and believe a combination of LBRDK/GLIBA is possible within the next couple of years.

Liberty Latin America: As a reminder, we made LILAK a large holding in late 2016/early 2017 after sharp declines related to a botched integration of an expensive deal for Cable & Wireless (CWC). CWC results showed signs of improvement in 2018, and Chile continued its steady performance. While management should be credited for its Puerto Rico[2] rebuild efforts, Puerto Rican operating cash flow was still down substantially year over year and prevented stock buybacks. A large institutional holder liquidated its LILAK investment during December, and the year-end declines therefore were more a function of stock supply/demand realities versus underlying business issues. LILAK currently trades at a 30+ percent discount to where Dr. Malone bought $37 million in 2017. We believe that free cash flow will improve materially in 2019 and we still think there is substantial room for future deals. Speaking of which, LILAK recently disclosed that it was in merger discussions with Millicom International Cellular SA, but then subsequently revealed that the talks had ended without a transaction. While there is consternation about issuing (versus repurchasing) cheap shares to support a large transaction, we believe a well-structured deal could create substantial value, given the importance of scale in the cable business. We trust the current team to consummate a deal only if it is in the best economic interest of LILAK shareholders. We suspect merger talks could resurface and we will discuss any transaction in more detail in future letters.

Liberty Global: Of all the cable names, LGI has been the biggest detriment to performance. Having owned it for years from its original 2004 spin, we sold too soon (with hindsight…more on this later) and then reentered the name too early. We were certainly aware that markets are more competitive in Europe, but we thought execution would be sharper (the biggest understatement in 2019) and did not anticipate the degree of negative regulatory action — nor did we bank on the rolling Brexit drama. LGI might be the most unpopular Liberty name we’ve ever owned. While the management team can be rightly criticized for operational execution, we would note that they have actively tried to arbitrage the difference between private and public market values (Netherlands, Austria, Germany, etc.). LGI faces two binary risks: hard Brexit and EU approval for Germany/Eastern European sales. On the former, other asset prices suggest a Brexit compromise, delay or second referendum are the more likely scenarios. On the latter, deal approval is not assured, but in our opinion EU jurisdiction (versus German) increases the odds to well over 50 percent. And as for the valuation? Nearly incomprehensible, even if there is little growth in the markets that remain. Consider that pro-forma for the deal closing, the VOD proceeds would equal ~80 percent of LGI’s current market capitalization or that LGI’s EV/EBITDA multiple (5.4x 2019E EBITDA) would be roughly half the valuation levels at which it is selling exiting assets.

Although we promised a “quick summary,” we can’t resist one detailed point: We have seen multiple sell- side reports assign near random number generator multiples to various “sum-of-the-parts” LGI valuations, based on bombed-out public market valuations. Could LGI’s Virgin assets (which will represent roughly 60 percent of pro-forma EBITDA) really be worth only 4x EBITDA? Virgin may not grow much outside its Lightning expansion, but it will still generate large amounts of free cash flow. Virgin’s Lightning expansion (where it is passing 4 million additional homes) gives a real-world test case of replacement value. If it costs £700 to pass a home that is often within 25 meters of its existing plant and another ~£250 in CPE costs, this would imply that Virgin’s replacement multiple is somewhere between 5-6x 2019E EBITDA, assuming 40 percent penetration. This value gives no credit for cash flow that the cable assets would generate while alternative fiber systems are constructed. Even using higher weighted average cost of capital estimates (despite existing inexpensive longer-term debt financing) and no growth, it is difficult to derive estimates much below 7-8x once any consideration for opportunity costs is considered. We think that the deal will be approved and that LGI could conceivably retire nearly 30-40 percent its share base this year.

“Risk Off” Financials

Jefferies: We covered both JEF and TSB in our Q3 letter and presented both names for The Manual of Idea’s Best Ideas conference earlier this month. JEF recently reported Q4 earnings (Nov 30 fiscal year) which showed some expected investment bank weakness, mostly concentrated in fixed income. However, the company also disclosed that it bought back nearly as much stock in October/November of 2018 as it had in the first nine months of 2019. In total, JEF repurchased 13 percent of its shares at just under $23 and authorized another $500 million repurchase plan. We detailed our thoughts on JEF’s net-asset-value in previous letters. We believe these buybacks will prove highly accretive over the next several years.

Permanent TSB: As discussed in our Q3 letter, TSB has a ~€700 million market capitalization but only a roughly €175 million float after taking into consideration the Irish government’s 75 percent interest. To say it is illiquid is an understatement. We have moved the stock with 15,000 share purchases, so volatility needs to be expected. As previously discussed, TSB has announced two securitizations that take non-performing loan (NPL) below 10 percent. We think further NPL reductions occur over 2019 and we still believe TSB can return roughly half its market capitalization through capital return sometime in the next year. In December, the Irish Ministry of Finance was authorized to sell its entire stake in Irish banks as it deemed fit. A widely discussed merger with similarly sized Ulster would offer the greatest upside. While it “feels” like it will never happen in our lifetime, it is metaphysically possible that European interest rates could rise and provide a substantial tailwind to this deeply unpopular sector. That said, we believe that substantial returns can be realized without either of these scenarios and occur simply as a result of the previously discussed capital return and modest loan growth in a red-hot housing market. Consider that the widely detested Euro Stoxx Banks Index trades at ~60 percent of book value. Capital return plus valuation improving to this level could drive substantial returns. While the price will fluctuate, the <0.4x tangible book value valuation provides substantial downside support.

Blackstone is the epitome of “risk off” name, and we used the volatility to increase our position. Market declines will impact the timing of asset sales and ultimately the collection of performance fees. Of course, every time we turn around, BX seems to raise another $10 billion which is locked up for 10+ years or sometimes permanently. While other private equity names may screen cheaper, BX has by far the strongest fundraising franchise. Additionally, investors perpetually underestimate the value of private equity’s performance fees and we suspect history is repeating itself here. Ultimately, the stock price should follow AUM levels. As the stock sold off in December, its forward dividend yield (blend of 2019 and 2020) was probably north of 8 percent. As discussed in previous letters, we think buybacks would create more long-term value when these names plummet, but we accept the capital allocation policy given the powerful secular tailwinds. We would vote against willingly paying more in taxes (aka C-Corp conversion), but we have little doubt the stock would pop should such a decision be made. Please see our Q2 2018 letter for more details on BX.

Compass Diversified Holdings is a middle-market focused owner of 10 businesses, from baby carriers (ergobaby) to quick-turn production circuity boards (Advance Circuits). We will not detail all the businesses (we can hear the cheers), but we’d simply note that each business is among the leaders in some smaller niche industry in which it operates. Think of CODI as a permanent capital public private equity firm with fantastic disclosure on each portfolio company. We had owned shares at varying points over the past 8 years but had generally exited over the past 1-2 years. We selectively re-entered as the stock was crushed during the fourth quarter.

CODI came public with a larger dividend partially because of a usual corporate structure (Delaware Trust) which required a payout to attract investors. Additionally, the original backer of CODI (Teekay shipping family) used the dividend to support its charitable endeavors. Historically, CODI funded acquisitions with cash on hand and with proceeds from business sales, as a large portion of its current cash flow was used to fund its payout. A chink in CODI’s business model was periodic lags between when CODI sold a business (generating nearly $800 million of gains since its 2006 IPO) and when it could deploy proceeds into new acquisitions. While the company was thoughtful on the timing of equity issuances, there was still dilution and, in our opinion, this limited the ultimate upside. We continued to follow the company and noted two favorable preferred issuances at attractive prices (for CODI) which should reduce equity issuances going forward. CODI probably would be better served by paying a reduced dividend and simply repurchasing shares during market selloffs, but its shareholder base (including its original backer) requires the dividend. While the stock has always traded at a discount to fair value, its discount can balloon out during market selloffs. During these periods, CODI’s management team and board members have consistently bought stock and this pattern repeated in December. Seeing a fully covered 11-13% dividend yield (which backers again need to make charitable contributions), multiple insider purchases and a breakup value 45-80% above current prices, we started buying as shares retreated back to 2011 levels.

Cheap, Less Leveraged Consumer Discretionary Names

Discovery Communications (DISCK) and Qurate (QTREA) have both been discussed in past letters. These names are probably among the most exposed to a recession that we own. As noted in our last letter, we reduced our DISCK position in the third quarter but started buying again as the stock plummeted. DISCK has significantly reduced its leverage since the Scripps acquisition and has gained traction on some of the virtual platforms. While not as statistically cheap as it was during the fall of 2017, DISCK still has a nearly 15%+ free cash flow yield and arguably has less downside risk now, given the traction on merger synergies and debt paydown. While we would prefer that CEO David Zaslov spend more time growing Eurosport subscribers versus proclaiming to be the “Netflix of golf, field hockey, skiing, ping pong, etc.,” the virtual deals he secured with Hulu and Sling provide substantial downside protection should cord cutting accelerate. We believe Comcast meaningfully overpaid for Sky, but the bid certainly suggests strategic value for international content assets. In public appearances, Zaslav has actively discussed the benefits of partnering with large technology companies and he has essentially done everything except place a post-it note on his forehead saying, “We are open to partnerships or takeovers.” We still think DISCK days as a standalone public company might be numbered.

Qurate: As lamented in past letters, QRTEA is something akin to the red headed stepchild of the Liberty empire and has often been shown little love, whether called LINTA, QVCA or now QRTEA. While there have been blips in quarterly performance that reignite the secular concerns, flagship asset QVC still boasts a sticky customer base and fantastic free cash flow conversion. It is more difficult for us to understand the 2018 rally in multiple brick and mortar stores when QRTEA appears to have a superior model, including: no operating store leases, limited capex requirements, an international franchise and 57 percent ecommerce penetration, with roughly 66% of this mobile. QRTEA can also generate substantial value from the HSN deal even in limited/no growth scenarios if HSN simply hits synergy numbers. QRTEA held up far better than other retailers during the 2008/2009 recession, but we concede its shares would likely suffer during a downturn. But at 14%+ free cash and debt levels low relative to historic levels, we think QRTEA is better positioned to take advantage of a downturn than it was entering the 2008/2009 recession.

Why Not Wait for 20% Declines Before Buying? …The Power of Hindsight

We want to quickly address two final topics. As noted at the beginning of the letter, we initially bought some of the above names at prices 20-25 percent higher than current prices and then continued adding as the names declined. While we understand this can be frustrating, our experience has been that this is rarely a unique experience. Certainly, we would prefer to perfectly time our initial purchase and have the stock rip higher the nanosecond after we enter. Unfortunately, this rarely occurs. As we won’t invest more than a set cost percentage in any single name, we try to anticipate declines and leave ourselves enough room to take advantage of corrections. The rallies can be just as swift as the declines, and feelings of loathing about buying too soon are replaced by twinges of regret for not buying enough – the investment equivalent of the view that the food is terrible and yet portion sizes are too small.

To take one example, the market valued CODI’s 10 different businesses roughly 4 percent higher on November 30 versus today. But, between November 30 and Christmas Eve, the stock fell nearly 18 percent before jumping 25 percent over the subsequent 3 weeks. There is certainly a debatable range around the value of the various businesses, but these estimates have not materially changed over the past 45 days. It was impossible to know that the stock would decline so rapidly before Christmas and equally impossible to know it would rally so quickly afterwards. In fact, a couple of ill-received Fed comments, Presidential Tweets or institutional redemptions could have sent shares down another 20 percent. While we didn’t bottom tick the Christmas Eve low, we added as shares declined and prepared for additional purchases should the selling continue. While individual purchase decisions will look better or worse with the benefit of hindsight, we do strive to follow a consistent methodology.

As previously noted, many of our names repurchase sizeable amounts of stock. At given points in time, these repurchase decisions can look very foolish short-term, but this may not be the same conclusion looking back several years after the buybacks. In 2012/2013, we made a rare technology investment, purchasing a tiny Redmond based software company named Microsoft (MSFT). We knew little about Azure (speaking of hindsight bias…that turned out to be a nice grower!), but we calculated that if Windows went to zero, this ~$26-$27 stock would still produce over $2.00 per share in free cash flow. Interestingly, one of the big debates at the time was over the amount of capital that MSFT “wasted” repurchasing shares. With shares virtually unchanged over the previous five years, an exhausted shareholder base was tired of looking at charts like this:

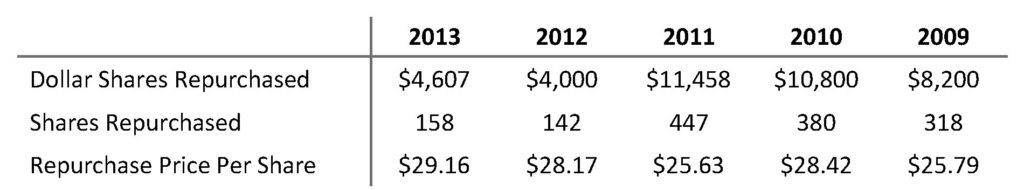
So how was the IRR on those share repurchases? Well, not so hot if you measured it in July of 2013. At current $100+ levels (we sold the last shares before $60…insert hindsight bias comment), the picture drastically changes. We suspect a similar story could unfold at several of the names discussed in this letter. While we aren’t predicting 4 baggers from current levels (…although we weren’t aware of any human predicting this type of return for MSFT back in 2012), we are confident that intrinsic value is meaningfully higher across the portfolio. And whether it is CHTR retiring shares at $290, JEF at $23 or QRTEA at $19, we suspect that criticisms over lower or negative share repurchase IRRs might be replaced in a couple of years with complaints about stingy repurchase decisions when shares are meaningfully above current levels. In this spirit, we would like to formally reprimand MSFT for only buying ~$40 billion of its stock between 2009-2013…since it is obvious (circa 2019) that shares were far too cheap.

In conclusion, we understand that periods of volatility like that experienced in the fourth quarter can be unsettling, especially as sizable gains can appear to be erased in a matter of days. That said, we do not believe these arbitrary declines reflect changes in the value of our underlying businesses. While we cannot predict when the price/value gap will converge, we think the gap has become unsustainably wide in multiple cases and this generally is a good omen for future returns. As always, we continue to spend large amounts of time stress testing our assumptions and will change our opinion as new information becomes available. We continue to invest sizeable amounts of personal capital in the names described above with the goal of compounding our investments with clients.

[1] Hites Ahir and Prakash Loungani Can economists forecast recessions? Some evidence from the Great Recession; as source data, the authors used Consensus Economics, which provides forecasts of real GDP for a group of professional forecasters for a large group of countries.
[2] In October 2018, LILAK purchased Searchlight Capital Partners, L.P’s 40 percent interest in Liberty Cablevision of Puerto Rico in exchange for 9.5 million LILAK shares.

Disclaimer: BAM’s investment decision making process involves a number of different factors, not just those discussed in this document. The views expressed in this material are subject to ongoing evaluation and could change at any time. Past performance is not indicative of future results, which may vary. The value of investments and the income derived from investments can go down as well as up. It shall not be assumed that recommendations made in the future will be profitable or will equal the performance of the securities mentioned here. While BAM seeks to design a portfolio which reflects appropriate risk and return features, portfolio characteristics may deviate from those of the benchmark. Although BAM follows the same investment strategy for each advisory client with similar investment objectives and financial condition, differences in client holdings are dictated by variations in clients’ investment guidelines and risk tolerances. BAM may continue to hold a certain security in one client account while selling it for another client account when client guidelines or risk tolerances mandate a sale for a particular client. In some cases, consistent with client objectives and risk, BAM may purchase a security for one client while selling it for another. Consistent with specific client objectives and risk tolerance, clients’ trades may be executed at different times and at different prices. Each of these factors influences the overall performance of the investment strategies followed by the Firm. Nothing herein should be construed as a solicitation or offer, or recommendation to buy or sell any security, or as an offer to provide advisory services in any jurisdiction in which such solicitation or offer would be unlawful under the securities laws of such jurisdiction. The material provided herein is for informational purposes only. Before engaging BAM, prospective clients are strongly urged to perform additional due diligence, to ask additional questions of BAM as they deem appropriate, and to discuss any prospective investment with their legal and tax advisers.

The Manual of Ideas – Winter 2018/2019 Edition

February 1, 2019 in The Manual of Ideas

As we embark on another year of investing, learning, and friendship, I am pleased to report that the MOI Global community has never been stronger. Engagement within the community, both online and offline, has never been higher. Anecdotally, I am hearing from a record number of members who reach out to share their meaningful experiences within the community. Particularly gratifying to me is the role of MOI Global as facilitator of new, impactful relationships among like-minded investors — relationships that have the potential to grow into lifelong friendships. In a world that feels increasingly short term-oriented and transactional, our goal is to build an authentic, long term-oriented investment community.

I’m not sure I would have arrived at this path were it not for the wisdom of my friend Guy Spier, who has made the “compounding of goodwill” into somewhat of a life philosophy. Guy shared his insights with fellow members during The Frankfurt Conversation last November.

We recently hosted the seventh annual edition of the Best Ideas online conference. Best Ideas 2019 featured more than eighty instructors from the MOI Global community.

I am always amazed by the amount of “signal” that can be extracted from this event. While not all ideas appeal to my personal investment philosophy, I found more than just a tidbit of insight in every session.

With so many sessions, where to begin?

Start with what piques your interest or, alternatively, you can’t go wrong investing your time with some of our most veteran instructors:

Phil Ordway has earned a reputation for dissecting misunderstood industries and business models in addition to highlighting specific ideas. At Best Ideas 2019, he dives deep into the meaning of “doing capital allocation right”. Capital allocation is not just about repurchasing shares. Rather, it is ingrained in the culture of firms that happen to be the best capital allocators. It is visible in how those companies do investor relations and how they empower employees to put decisions through a capital allocations framework. Phil discusses case studies of companies that take the right approach — at least a few of those names will be new to you in this context.

Jim Roumell has been a mentor to the MOI Global community by virtue of his quiet, steady leadership on a number of fronts: Jim has talked instructively about resilience and character (“pressure is a privilege”), his investment approach focused on downside protection and upside optionality (“multiple shots on goal”), and the mistake he made some years ago of “trying to go big” in terms of scaling assets under management. You won’t find this kind of self-reflection and openness walking down Wall Street. Jim’s talk at Best Ideas 2019, while focused on a specific idea, contains much wisdom that is applicable broadly to the practice of value investing.

Amit Wadhwaney is like a rock on the international value investing scene. While the vast majority of global investors is swayed by the latest trends, fund flow statistics, or geopolitics du jour, Amit sticks with companies that trade far below a conservative estimate of net asset value. In doing so, Amit has weathered many macro storms, both at Third Avenue and more recently at Moerus Capital Management. Amit’s approach is eminently accessible — he has discussed it eloquently on numerous occasions, including in 2012, 2014, 2016, 2017, and 2018. The trouble is that most investors don’t have the psychological makeup to accept the very real possibility of looking foolish for a while. The idea Amit shares at Best Ideas 2019 is no different.

It seems like a prophetic coincidence that Amit’s “best idea” also happens to be the “best idea” of another MOI Global mentor and bona fide contrarian — Bob Robotti. Bob’s expertise and long-term investment success in the energy sector is well-known in value investing circles. Many of those in the broader investment community, who now proclaim that oil and gas is dead, were barely alive when Bob experienced an even bigger industry downturn several decades ago. The legitimate move toward alternative energy notwithstanding, the same way the industry recovered back then, it appears likely to recover this time around — driven by good ol’ “supply and demand”. The world consumes ever more energy, and it has to come from somewhere. Bob and Amit’s “best idea” for 2019 is a cheap, well-financed leader in an admittedly commoditized segment of the industry.

Another “veteran” of MOI Global online conferences, despite his decidedly shorter time in the investment business as compared to Bob or Amit, is Elliot Turner. I highlight Elliot because I have always found the “signal value” of his presentations to be top-notch. It’s no different in terms of his Best Ideas 2019 presentation, in which he discusses a familiar name (PayPal) and a less familiar one (Roku). Elliot’s differentiated thesis on Roku has led me to add it to my watchlist.

Glenn Surowiec is another long-time MOI Global instructor who tends to “fly below the radar” yet consistently impresses with his contrarian mindset and focus on the key drivers of an investment. I have rarely found someone who is quite as able to ignore the noise in order to focus on the key drivers of an investment as has been the case with Glenn. The kinds of transitory or tangential considerations that scare away other investors have no impact on Glenn. When he informed me that he did not have a compelling presentation to share at Best Ideas 2019, I was not going to take “no” for an answer, and Glenn generously agreed to have a conversation about his current take on market opportunities.

Finally, I’d like to thank Mr. Market for his recent mood swings. They have made numerous Best Ideas 2019 presentations more timely than they might have been otherwise. Happy fishing!

I am deeply grateful to our members for helping to shape MOI Global into a truly special kind of community.

Warm regards,

JOHN MIHALJEVIC, CFA
Chairman, MOI Global

Members, log in below to access the restricted content.

Not a member?

Thank you for your interest.  Please note that MOI Global is closed to new members at this time. If you would like to join the waiting list, complete the following form:

Solventis sobre Prosegur Cash

February 1, 2019 in Ideas de inversión, MOI Global en Español

NOTA DEL EDITOR: Esta idea de inversión es obtenida de una carta de Solventis EOS.

* * *

Precio: 1,75€ (31 octubre 2018)

Precio de adquisición: 1,79€

Deuda Neta ajustada: 586 millones de euros.

Per ajustado: 10x

El dicho popular: “No te creas nada de lo que te digan y tan solo la mitad de lo que veas ”nos invita a retar constantemente si lo que leemos o nos cuentan es cierto o está sesgado. Cuando cuestionamos cualquier narrativa despertamos la curiosidad y las ganas de saber más. En ese momento surge el investigador que todos llevamos dentro y nos ponemos a buscar datos y cifras que verifiquen o desmientan la historia que habíamos leído o escuchado.

Continue reading »

Daniel Baldini on Investing in Community Banks

January 31, 2019 in Equities, Financials, Interviews, Micro Cap, North America, Small Cap, Video Excerpt, YouTube

We are pleased to bring you the following excerpt from our exclusive interview with Daniel Baldini, managing partner of Oberon Asset Management.

In a conversation with MOI Global contributor and former Barron’s columnist David Englander, Dan shares insights into the firm’s approach to investing in community banks.

Prior to founding Oberon in 2001, Dan was an investment officer at the International Finance Corporation in Washington, D.C. Previously, he worked for Electra Investment Trust in London. Dan holds an MBA from Stanford.

watch the full 43-minute conversation

Access Dan’s presentations at MOI Global Online Conferences:

  • Wizz Air: Taking Market Share, Growing Cost Advantage and Earnings
  • HolidayCheck: Growth to Accelerate at Leading German Hotel Review Site
  • School Specialty: Education Business with Hidden Growth Drivers

Members, log in below to access the restricted content.

Not a member?

Thank you for your interest.  Please note that MOI Global is closed to new members at this time. If you would like to join the waiting list, complete the following form:

Highlighted Tweet by MachHBInvesting

January 30, 2019 in Twitter

Charles Hoeveler on Investing in Small-Cap Compounders

January 29, 2019 in Ideaweek, Ideaweek Podcast, Podcast, Small Cap, Transcripts

In an episode of the Ideaweek Podcast, presented by MOI Global, Charles Hoeveler discusses his approach to investing in high-quality small-caps that can compound shareholder value organically for a long time to come.

Charles manages Norwood Capital Partners, based in the San Francisco Bay Area. He has more than fifteen years of experience in institutional asset management. Norwood is a concentrated, fundamental value long/short investment fund. It relies on primary research to build a portfolio of dominant businesses trading at a discount to intrinsic value.

Members, log in below to access the restricted content.

Not a member?

Thank you for your interest.  Please note that MOI Global is closed to new members at this time. If you would like to join the waiting list, complete the following form:

Update on Our Investments in Community Banks

January 29, 2019 in Financials, Ideas, Letters

This article is authored by MOI Global instructor Phil Ordway, Managing Principal at Anabatic Investment Partners, based in Chicago, Illinois.

Our bank investments remain anchored by OceanFirst (OCFC). I remain optimistic on OCFC’s prospects, as well as the opportunities in the sector overall. The KBW Nasdaq Bank Index declined 19.2% in 2018 while the S&P 500 Financials fell 14.7%.[1] It is ironic, to say the least, that market prices dropped in a year featuring a large tax cut and the ongoing “normalization” of interest rates (to say nothing of very benign credit conditions, decent growth, and a generally sound economy). This is yet another example of expectations trumping all else, and why I find it more reliable to consider multi-year business value as the key investment barometer.

The overwhelming majority of individual banks I follow also saw significant declines in the market price of their equity during 2018, but those declines imply dour fundamentals in 2019 and beyond. I am not dismissive of the chances of a recession this year – or any year – but when a recession inevitably arrives most banks will face it with good credit profiles, ample reserves, and plenty of liquidity. Earnings will decline as many banks add to credit reserves and slow or reverse asset growth, but that is normal.

I will repeat my comment of recent years: I see the U.S. banking industry as better capitalized and safer overall than at any other point in its modern history. Regardless of what the economy produces in 2019, much lower security prices and a suddenly gloomy market temperament offer an attractive opportunity over the next several years.

*******

OCFC shares returned (12.3%) during 2018 – including a (12.7%) result in December alone – but the company made progress in its business. The acquisition of Sun Bancorp closed in January 2018 and was well integrated by the fall. In October, OceanFirst also announced its acquisition of Capital Bank of New Jersey for $80 million.[2] It is a small deal but nonetheless an excellent fit from an operational, geographic, and financial perspective.

It is important to remember that OceanFirst has a stable, low-cost deposit base paired with conservative credit and lending profile. As interest rates have increased the company has benefited from its deposit franchise – the cost of deposits has lagged rate increases to an impressive degree, all while the bank has increased its share of funding from core deposits – and yet the market’s valuation on those deposits has fallen by about half.[3]

When the economy does enter a downturn, the company will benefit from its credit discipline and excess liquidity, having intentionally avoided overconcentration in commercial real estate and loans with weak structures. And as we wait to see how macro conditions will develop, OCFC is plowing ahead with its profitable, efficient operation. Credit quality is excellent, with non-performers at just 0.3% of total assets. Net income is running close to 1.2% on assets and 15% on tangible common equity, and the company’s efficiency ratio is in the low-50% range, a level on par with the best community banks in the country. I remain impressed by CEO Chris Maher and his team, and their strategy should work well in a variety of future environments.

At a current earnings yield of approximately 10%, the expectations baked into the stock price are low. I am as vigilant as ever for signs of credit deterioration, a degradation of the culture, or management mistakes, but other than some marginal reallocation to new opportunities I expect to hold our OCFC investment for the foreseeable future.

A brief update on our other community bank investments:

Bank H was a new investment in 2017. This bank navigated a boom-and-bust in the local economy, producing excellent credit results and good profits along the way. It also has a large, low-cost deposit base that would be very valuable to an acquirer. A sale of the company remains possible but looks less likely than it did a year or two ago. The recent market price for this investment implied very low expectations, and our decision to hold, buy more, or sell in favor of a better opportunity will be determined by the investment prospects here weighed against our other options.

Bank I was a new investment in the second quarter of 2018. It remains a very small position as we paused our buying to pursue other opportunities. This bank has made progress in recent years by keep a lid on expenses and leveraging its net interest income. Depending on the company’s prospects and the other opportunities available during 2019 I would expect to increase our investment or sell the shares we currently hold.

The following table reflects our current holdings in community banks as of December 31, 2018.


Price data as of 2 January 2019. Sources: SEC filings, Call Reports, FactSet, and Anabatic estimates.
Figures reflect the most recently reported quarter and are adjusted and estimated as applicable to reflect current annualized levels.
1 Market price divided by tangible book value, as reported
2 Non-performing assets (non-performing loans + foreclosures / other real estate owned) divided by total assets, as reported
3 Tangible common equity divided by tangible assets, as reported
4 Estimated percentage of the company’s current shares outstanding likely to be repurchased under existing buyback authorization
5 Net interest margin, adjusted and annualized
6 Return on assets, adjusted and annualized
7 Return on common equity, adjusted and annualized
8 Market price divided by net income per share, adjusted and annualized
9 Efficiency Ratio = non-interest expenses divided by the sum of net interest income and non-interest income, as reported
10 Mutual holding company conversion — the year in which the company converted to public ownership
11 The core deposit premium is the excess of equity market value over tangible book value, expressed as a percentage of core deposits

[1]Both are indices presented for reference only, and the latter is even less relevant than the former. Both figures include dividends. Source: Nasdaq and Standard & Poor’s.
[2]CANJ provides an excellent funding base with a 0.46% average cost of deposits and a 70% loan-to-deposit ratio. It is also surprisingly profitable, posting a trailing ROA of over 1.3% and ROTCE of over 14% (on a reasonable level of 9.2% tangible common equity). The efficiency ratio of 55% and near absence of non-performing assets – 0.08% at the recent quarter – point to an operational fit as well. The worst thing I can find about the deal is that it wasn’t big enough to make a large difference for OceanFirst overall.
[3]As noted in previous letters, approximately 85% of OceanFirst’s total deposits are “core” deposits and the total cost of deposit funding in the third quarter of 2018 was just 39 basis points – 0.39% – up from 33 basis points in the first quarter and 29 basis points in the prior year period. The core deposit premium stood at approximately 8% at December 31, 2018, down from 16% at June 30, 2018.

Disclaimer: Gross Long and Gross Short performance attribution for the month and year-to-date periods is based on internal calculations of gross trading profits and losses (net of trading costs), excluding management fees/incentive allocation, borrowing costs or other fund expenses. Net Return for the month is based on the determination of the fund’s third-party administrator of month-end net asset value for the referenced time period, and is net of all such management fees/incentive allocation, borrowing costs and other fund expenses. Net Return presented above for periods longer than one month represents the geometric average of the monthly net returns during the applicable period, including the Net Return for the month referenced herein. An investor’s individual Net Return for the referenced time period(s) may differ based upon, among other things, date of investment. In the event of any discrepancy between the Net Return contained herein and the information on an investor’s monthly account statement, the information contained in such monthly account statement shall govern. All such calculations are unaudited and subject to further review and change. For purposes of the foregoing, the calculation of Exposure Value includes: (i) for equities, market value, and (ii) for equity options, delta-adjusted notional value.

THE INFORMATION PROVIDED HEREIN IS CONFIDENTIAL AND PROPRIETARY AND IS, AND WILL REMAIN AT ALL TIMES, THE PROPERTY OF ANABATIC INVESTMENT PARTNERS LLC, AS INVESTMENT MANAGER, AND/OR ITS AFFILIATES. THE INFORMATION IS BEING PROVIDED SOLELY TO THE RECIPIENT IN ITS CAPACITY AS AN INVESTOR IN THE FUNDS OR PRODUCTS REFERENCED HEREIN AND FOR INFORMATIONAL PURPOSES ONLY.

THE INFORMATION HEREIN IS NOT INTENDED TO BE A COMPLETE PERFORMANCE PRESENTATION OR ANALYSIS AND IS SUBJECT TO CHANGE. NONE OF ANABATIC INVESTMENT PARTNERS LLC, AS INVESTMENT MANAGER, THE FUNDS OR PRODUCTS REFERRED TO HEREIN OR ANY AFFILIATE, MANAGER, MEMBER, OFFICER, EMPLOYEE OR AGENT OR REPRESENTATIVE THEREOF MAKES ANY REPRESENTATION OR WARRANTY WITH RESPECT TO THE INFORMATION PROVIDED HEREIN. AN INVESTMENT IN ANY FUND OR PRODUCT REFERRED TO HEREIN IS SPECULATIVE AND INVOLVES A HIGH DEGREE OF RISK. THERE CAN BE NO ASSURANCE THAT THE INVESTMENT OBJECTIVE OF ANY SUCH FUND OR PRODUCT WILL BE ACHIEVED. MOREOVER, PAST PERFORMANCE SHOULD NOT BE CONSTRUED AS A GUARANTEE OR AN INDICATOR OF THE FUTURE PERFORMANCE OF ANY FUND OR PRODUCT. AN INVESTMENT IN ANY FUND OR PRODUCT REFERRED TO HEREIN CAN LOSE VALUE. INVESTORS SHOULD CONSULT THEIR OWN PROFESSIONAL ADVISORS AS TO LEGAL, TAX AND OTHER MATTERS RELATING TO AN INVESTMENT IN ANY FUND OR PRODUCT.

THIS IS NOT AN OFFER TO SELL OR SOLICITATION OF AN OFFER TO BUY AN INTEREST IN A FUND OR PRODUCT. ANY SUCH OFFER OR SOLICITATION WILL BE MADE ONLY BY MEANS OF DELIVERY OF A FINAL OFFERING MEMORANDUM, PROSPECTUS OR CIRCULAR RELATING TO SUCH FUND AND ONLY TO QUALIFIED INVESTORS IN THOSE JURISDICTIONS WHERE PERMITTED BY LAW.

ALL FUND OR PRODUCT PERFORMANCE, ATTRIBUTION AND EXPOSURE DATA, STATISTICS, METRICS OR RELATED INFORMATION REFERENCED HEREIN IS ESTIMATED AND APPROXIMATED. SUCH INFORMATION IS LIMITED AND UNAUDITED AND, ACCORDINGLY, DOES NOT PURPORT, NOR IS IT INTENDED, TO BE INDICATIVE OR A PREDICTOR OF ANY SUCH MEASURES IN ANY FUTURE PERIOD AND/OR UNDER DIFFERENT MARKET CONDITIONS. AS A RESULT, THE COMPOSITION, SIZE OF, AND RISKS INHERENT IN AN INVESTMENT IN A FUND OR PRODUCT REFERRED TO HEREIN MAY DIFFER SUBSTANTIALLY FROM THE INFORMATION SET FORTH, OR IMPLIED, HEREIN.

PERFORMANCE DATA IS PRESENTED NET OF APPLICABLE MANAGEMENT FEES AND INCENTIVE FEES/ALLOCATION AND EXPENSES, EXCEPT FOR ATTRIBUTION DATA, TO THE EXTENT REFERENCED HEREIN, OR AS MAY BE OTHERWISE NOTED HEREIN. NET RETURNS, WHERE PRESENTED HEREIN, ASSUME AN INVESTMENT IN THE APPLICABLE FUND OR PRODUCT FOR THE ENTIRE PERIOD REFERENCED. AN INVESTOR’S INDIVIDUAL PERFORMANCE WILL DIFFER BASED UPON, AMONG OTHER THINGS, THE FUND OR PRODUCT IN WHICH SUCH INVESTMENT IS MADE, THE INVESTOR’S “NEW ISSUE” ELIGIBILITY (IF APPLICABLE), AND DATE OF INVESTMENT. IN THE EVENT OF ANY DISCREPANCY BETWEEN THE INFORMATION CONTAINED HEREIN AND THE INFORMATION IN AN INVESTOR’S MONTHLY ACCOUNT STATEMENT IN RESPECT OF THE INVESTOR’S INVESTMENT IN A FUND OR PRODUCT REFERRED TO HEREIN, THE INFORMATION CONTAINED IN THE INVESTOR’S MONTHLY ACCOUNT STATEMENT SHALL GOVERN.

NOTE ON INDEX PERFORMANCE: INDEX PERFORMANCE DATA AND RELATED METRICS, TO THE EXTENT REFERENCED HEREIN, ARE PROVIDED FOR COMPARISON PURPOSES ONLY AND ARE BASED ON (OR DERIVED FROM) DATA PUBLISHED OR PROVIDED BY EXTERNAL SOURCES. THE INDICES, THEIR COMPOSITION AND RELATED DATA GENERALLY ARE OWNED BY AND ARE PROPRIETARY TO THE COMPILER OR PUBLISHER THEREOF. THE SOURCE OF AND AVAILABLE ADDITIONAL INFORMATION REGARDING ANY SUCH INDEX DATA IS AVAILABLE UPON REQUEST.

MOI Global