This post has been excerpted from a letter by Matthew Fine, Lead Portfolio Manager of the Third Avenue International Value Fund.
Simply stated, we are of the view that a rising copper price over time is a fairly high probability outcome for a variety of reasons described below. Simultaneously, we believe that consensus views have pushed security prices to levels that reflect a very low probability of that outcome. This mispricing process has occurred over the last several years with the consensus rhetoric regarding the copper mining industry comprised of headlines suggesting that China’s economic growth is slowing, copper is oversupplied and metals, in general, remain tied at the hip to Chinese residential construction. These easily consumed bits of perceived wisdom are, in our view, rife with gross oversimplifications and obfuscating generalizations, as consensus views often are. Furthermore, we believe that the companies we own present very attractive long-term value more than reflective of risks to our expectations for the industry.
Chinese Economic Growth is Slowing and That’s O.K.
To say that Chinese economic growth is slowing, which appears to be true, is a profoundly different statement than to say that the economy is shrinking or in decline. Furthermore, this acknowledgement in no way suggests a decline in consumption of any one metal, let alone all metals simultaneously. Slowing growth is a near mathematical certainty for fast growing companies or fast growing economies. For many people it is surprising that a constant growth rate compounding over time produces a parabolic trajectory and a slowing or declining growth rate produces a steadily rising trajectory.
Growth of China GDP
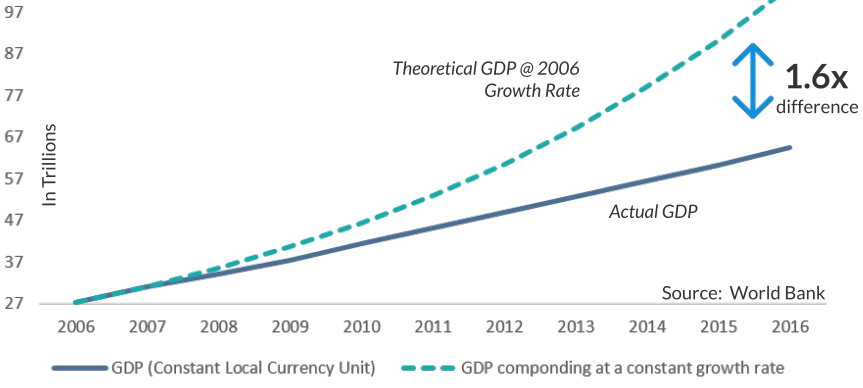
Because “trees don’t grow to the sky”, growth of corporate revenues or the size of an economy cannot grow continuously at large growth rates taking on a parabolic trajectory indefinitely. Here are some actual figures to illustrate the point further – according to the World Bank, in 2010 Chinese GDP was CNY 41.3 trillion having grown by 10.6% that year, which means that it added roughly CNY 3.97 trillion of incremental economic activity in 2010, as compared to the prior year. In 2016, GDP was estimated to be CNY 64.4 trillion, having grown a disappointing 6.7%. Pedestrian as 6.7% growth might be by Chinese standards, it means that the Chinese economy added approximately CNY 4.04 trillion of incremental economic activity in 2016, meaning more additional economic activity was added in 2016 than in 2010, even though the growth rate declined. This results from growth on a much larger base of economic activity. Declining growth rates are an entirely healthy and necessary condition for continued growth of rapidly developing countries or companies due to the simple math of compounding effects.
Commodities Must Be Evaluated Independently
Frequently, consensus views are framed in vague, generalist terms. For example, a common refrain in recent years has been that commodities are in a state of excess supply. I would be hard-pressed to find a less illuminating statement in financial market commentary. Oil, for, example has its own unique supply and demand dynamic. Readily available oil supply has exceeded demand for the majority of the time since the late 1800s. Some type of supply limiting construct (i.e., Standard Oil’s monopoly position, the Achnacarry Agreement, the Texas Railroad Commission and OPEC), has consistently been required to act as a governor to limit the supply that would otherwise be brought to market. Agricultural commodity supply, on the other hand, is specific to each agricultural commodity, is typically dictated by discreet crop years, is generally weather-dependent and is, therefore, not predictable with any accuracy over multi-year periods. Zinc is at the moment experiencing its lowest levels of inventories in nearly a decade with little prospect of available supply with which to meet the excess demand. Lundin Mining, one of our copper mining investments, also happens to be a large-scale producer of zinc. A “tight” zinc market and an elevated zinc price is the prevailing state of that industry, which is a dynamic completely divorced from the average headline describing the state of industrial metals.
Total Global Zinc Inventories
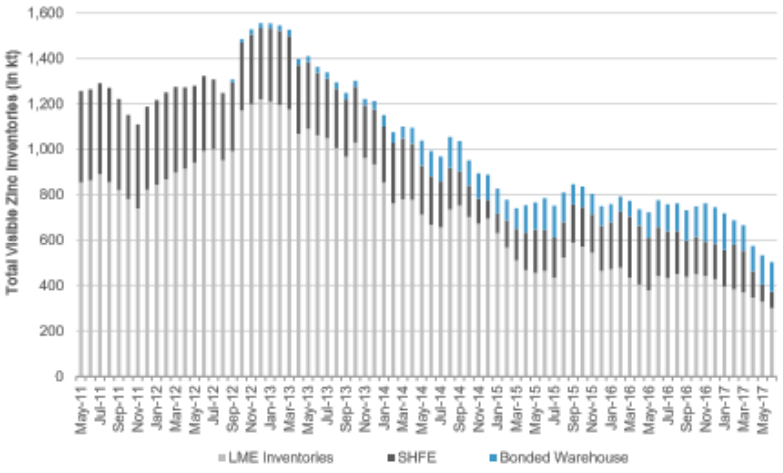
Source: Bloomberg, Scotiabank GBM.
Meanwhile, copper is currently in a very balanced state of supply and demand. With demand continuing to grow and a relative dearth of new supply emerging over the next several years, most analysis points to an emerging supply shortfall in coming years. Wood Mackenzie, the natural resources consultancy, estimates that the current pipeline of copper development projects is less than half of the levels seen in 2004, which was itself marked by a dearth of development and predated the period of rapid “super-cycle” supply growth from 2005 – 2008. Given that it typically takes a decade or more to bring a new copper resource into production, the future of supply is relatively well known as compared to oil or agricultural commodities for example. There are few, if any, generalizations to be made about supply and demand balances which accurately pertain to disparate commodities. Each industry must be analyzed independently and our view is that both the copper and zinc mining industries appear to be in an increasingly favorable position.
Copper Supply Shortfall Appears More Likely Than Not
International Copper Study Group (ICSG), an intergovernmental organization, estimates that since 1900, global consumption of copper has grown at approximately 3.4% per year on average. Over the last decade, which includes the worst global financial crisis since the Great Depression, copper consumption has grown at roughly 2.5% per year. Should copper consumption continue to grow at say 2% per year, estimates suggest that over the next decade, the world must identify and bring into production new producing copper resources equivalent to nearly 50% of current existing production in order to accommodate that level of demand growth combined with natural levels of resource depletion.
Copper Mine Production Peaks in 2019
(existing and fully committed mines)
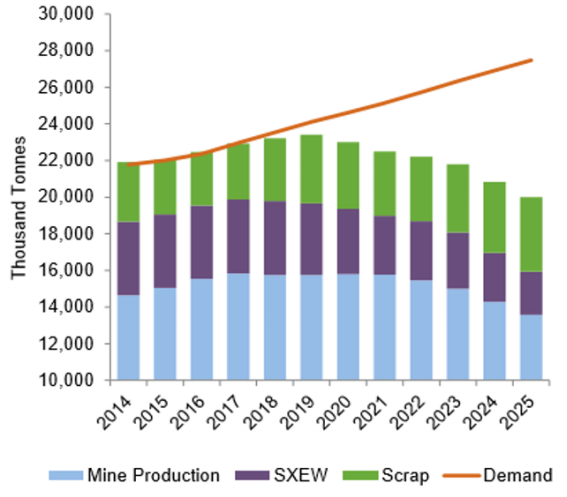
Source: Wood Mackenzie, CRU, ICSG, Teck.
Copper LME Cash Price and Global Supply/Demand Balance
(left axis: ‘000t Cu, right axis: $/t)
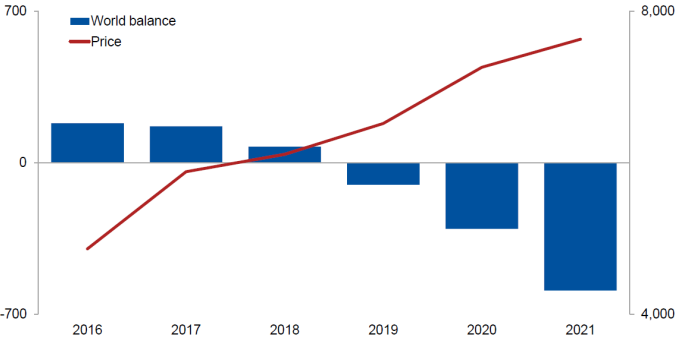
Source: CRU.
Given that: a) minimal investment has been made in recent years as a result of the low price environment, b) the current price of copper does not incentivize the investment required to bring new mines into production and c) it can take ten years to bring a new mine into production, the prospect of growing global copper production able to meet 2% consumption growth over the next ten years is extraordinarily improbable absent far higher copper prices to incentivize enormous investment, and even then it may not be possible.
In the words of commodity industry consultancy CRU Group, “as long as global demand continues to expand at close to 2% per annum, structural deficits in this [copper] market appear inevitable.” For the record, most estimates suggest that copper prices must be at least in the range of USD $3.30 per pound (i.e., 22% higher than at present) to begin to incentivize new mine development. Those price levels would be very beneficial to Fund performance.
Copper Grade Declines to Continue to Pressure Copper Prices Upward
Over the last few decades, since the copper discovery boom that gave rise to the Chilean copper mining industry in the early 1980s, the industry has since seen a consistent multi-decade trend of grade declines, which means that far more rock must be dug up, crushed and processed to produce the same amount of copper. This phenomenon takes place because the copper mining industry has been unable to identify new copper resources equivalent to that which has been mined in the past or is being mined today. It is also clear from analysis of global reserve grades (the grade of the ore that will be mined in future years) that copper ore grades are very likely to continue declining, which will continue to put a constant upward pressure on the cost of production, which, all else being equal, will render mines feasible only at ever higher copper prices. As a tangible example, CODELCO, the world’s largest copper miner, has seen its ore grades decline by more than 30% over the last two decades through 2015 and its cost of production balloon as a result.
Copper Ore Grade Decline
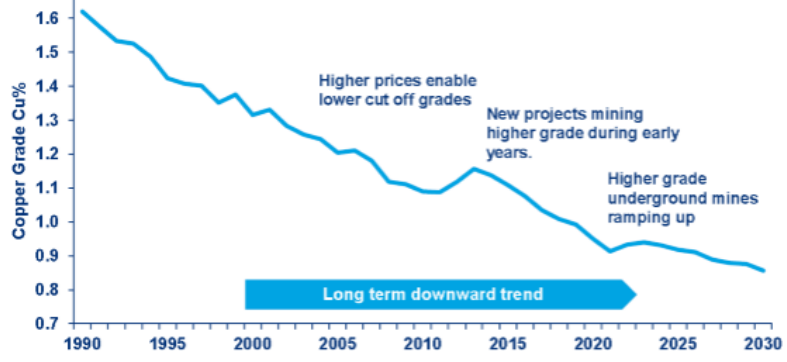
Source: Wood Mackenzie.
Relatively Diversified End Uses of Copper
Copper is commonly included in discussion with other industrial metals. Steel for example, roughly 50% of which is also consumed by China, is predominantly used in building and infrastructure construction as well as auto manufacturing. Zinc, is mostly used to galvanize steel. Copper on the other has among the most varied uses of any metal and therefore among the most diversified sources of demand.
Chinese Copper End Use, 2016
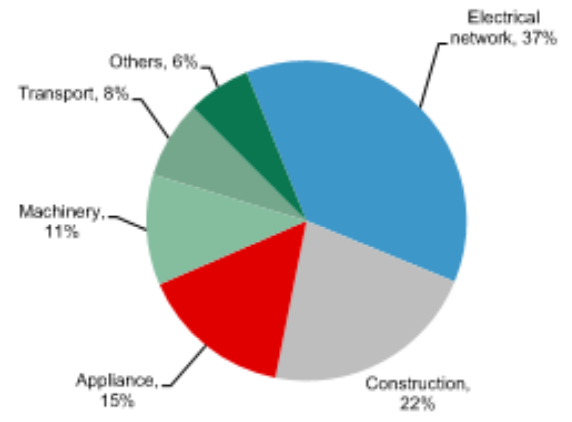
Source: Wood Mackenzie, Scotiabank GBM.
China Power Grid Development Annual Spending
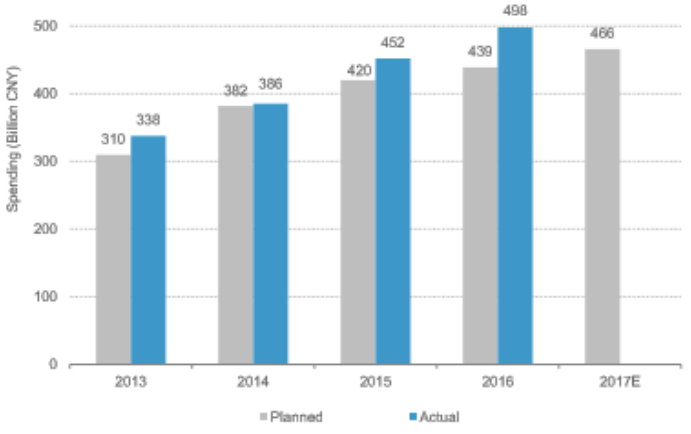
Source: CNEA, Scotiabank GBM.
Importantly, copper is not merely a construction metal. In China, demand is driven by the strategic rollout of electrical grid infrastructure, which is directed by an extremely well-financed state owned enterprise, as opposed to a potentially indebted private construction company. Demand is also driven by consumption of electronics, appliances and autos, all of which continue to benefit from increasing per capita wealth. Further, global environmental consciousness has led to increasing emphasis on electrified vehicles and clean energy. It is estimated that an average hybrid car demands twice the amount of copper as that of a typical gasoline car while a fully electric vehicle demands three times as much. Solar and wind energy are also extremely copper intensive propositions.
For all of these reasons it appears more likely than not that copper consumption will continue to grow over time and that the script for supply constraints is largely written.
Valuations of Our Investments Are Extremely Attractive
As broad filters for our investment activity in general, but particularly so for our mining investments, we place great emphasis on balance sheet strength and favor companies with a competitive cost position to accommodate inherent volatility of business conditions. We believe that maintaining our risk aversion does not diminish our return prospects as it relates to our copper investments as the valuations of our companies today are inexplicably compelling. Our largest position, Capstone Mining, is a small-cap Vancouver-based producer with all of its operations in the Americas, taking on an unusually low level of political/jurisdictional risk for a mining company. As challenged as headlines would suggest the copper mining industry is today, the price of copper has averaged roughly USD $2.61 per pound in the first half of 2017, up roughly 5.5% since the beginning of the year, and is currently at approximately USD $2.70 per pound. Around these copper prices, Capstone Mining should produce more than USD $100 million of operating cash flow on an annual basis, which it will use to reinvest in its assets and further amortize its debt, which is already modest at 1.2x trailing EBITDA as of its most recent quarter. Further, the bulk of this cash flow is derived from assets with long mine lives. To put Capstone’s level of cash flow in perspective, the company’s current market capitalization is approximately only USD $261 million. Further, the company recently agreed to sell an asset that had been held at zero carrying value, for approximately USD $23 million. Even absent further increases in copper prices over time, which we believe are more likely to occur than not, we are very excited about the return prospects presented by Capstone’s operating performance under current conditions.
Our other two copper mining investments include Lundin Mining and Antofagasta plc, both of which are among the most robustly well-capitalized companies in any segment of the mining industry today. Recall our requirement that we must approach investment opportunities with a sense of risk aversion and avoidance of permanent impairment of our capital, notwithstanding our favorable expectations for the copper mining industry. Further, we are appreciative of our investment mandate which allows the pursuit of global opportunities – Lundin and Capstone are Canadian listed – while Antofagasta is listed in London but with operations almost exclusively in Chile. Furthermore, our ability to invest across the market capitalization spectrum has allowed us to pursue opportunities in this space both large and small. We view Capstone Mining’s current valuation as unjustifiably cheap. While Lundin and Antofagasta do not rival Capstone’s valuation, they are indeed inexpensive and are both among the industry’s elite in terms of asset quality, cost of production and balance sheet strength.
IMPORTANT INFORMATION
This publication does not constitute an offer or solicitation of any transaction in any securities. Any recommendation contained herein may not be suitable for all investors. Information contained in this publication has been obtained from sources we believe to be reliable, but cannot be guaranteed.
The information in this portfolio manager letter represents the opinions of the portfolio manager(s) and is not intended to be a forecast of future events, a guarantee of future results or investment advice. Views expressed are those of the portfolio manager(s) and may differ from those of other portfolio managers or of the firm as a whole. Also, please note that any discussion of the Fund’s holdings, the Fund’s performance, and the portfolio manager(s) views are as of June 30, 2017 (except as otherwise stated), and are subject to change without notice. Certain information contained in this letter constitutes “forward-looking statements,” which can be identified by the use of forward-looking terminology such as “may,” “will,” “should,” “expect,” “anticipate,” “project,” “estimate,” “intend,” “continue” or “believe,” or the negatives thereof (such as “may not,” “should not,” “are not expected to,” etc.) or other variations thereon or comparable terminology. Due to various risks and uncertainties, actual events or results or the actual performance of any fund may differ materially from those reflected or contemplated in any such forward-looking statement. Current performance results may be lower or higher than performance numbers quoted in certain letters to shareholders.
Date of first use of portfolio manager commentary: July 19, 2017
Past performance is no guarantee of future results; returns include reinvestment of all distributions. The above represents past performance and current performance may be lower or higher than performance quoted above. Investment return and principal value fluctuate so that an investor’s shares, when redeemed, may be worth more or less than the original cost. For the most recent month-end performance, please visit the Fund’s website at www.thirdave.com. The gross expense ratio for the fund’s institutional and investor share classes is 1.40% and 1.65%, respectively, as of March 1, 2017. Please be aware that foreign securities from a particular country may be subject to currency fluctuations and controls, or adverse political, social, economic or other developments that are unique to that particular country or region. Therefore, the prices of foreign securities in particular countries or regions may, at times, move in a different direction than those of U.S. securities. Prospectuses contain more complete information on management fees, distribution charges, and other expenses.
Third Avenue Funds are offered by prospectus only. The prospectus contains important information, including investment objectives, risks, advisory fees and expenses. Please read the prospectus carefully before investing in the Funds. Investment return and principal value fluctuate so that an investor’s shares, when redeemed, may be worth more or less than the original cost. For updated information or a copy of our prospectus, please call 1-800-443-1021 or go to our web site at www.thirdave.com. Distributor of Third Avenue Funds: Foreside Fund Services, LLC.
Current performance results may be lower or higher than performance numbers quoted in certain letters to shareholders.
About The Author: Matthew Fine
Mr. Fine is the Lead Portfolio Manager of Third Avenue’s International strategies —the Third Avenue International Value Fund and the Third Avenue International Value Fund UCITS—and a member of Third Avenue’s Management Committee. As member of Third Avenue’s Management Committee, Mr. Fine contributes in defining and implementing the firm’s strategic goals
Mr. Fine joined Third Avenue in 2000 and began working with Third Avenue’s international team in an effort to identify investment opportunities in the wake of the Argentine crisis of 2001. Mr. Fine has extensive global investment experience having been responsible for myriad investments in developed and developing markets across North America, Latin America, Europe and Asia.
Mr. Fine joined Third Avenue’s research and portfolio management team as a Research Associate, the first position typically held by Third Avenue’s internally developed talent. He became a Senior Research Analyst in 2008, a principal of the firm in 2009 and Lead Manager of the Third Avenue International Value Fund in 2014.
Mr. Fine holds a B.A. in Economics from Hamilton College. He is a CFA Charterholder, a member of the New York Society of Security Analysts and a member of the Board of Trustees of Suffield Academy.
More posts by Matthew Fine