This article is authored by MOI Global instructor Sean Stannard-Stockton, president and chief investment officer of Ensemble Capital Management, based in Burlingame, California. Visit Ensemble’s Intrinsic Investing website for additional insights.
“My interest is in the future because I am going to spend the rest of my life there. ” –C.F. Kettering
Bottom up stocks pickers like ourselves, who run focused portfolios, often say they are “macro agnostic”. Rather than trying to time the market or predict the economic cycle, we focus on finding outstanding, competitively advantaged business that we think can do well across economic and market cycles. But while the short-term economic cycle is unpredictable, it is vitally important that investors understand the long-term economic forecasts embedded in their individual company valuations.
When valuing an individual company, the very long-term growth rate will be constrained by economic growth, the level of interest rates will significantly impact the financing costs of businesses that borrow money (99% of the S&P 500 borrows money), and interest rates indicate the “risk free” rate of return hurdle over which equity investors demand some level of additional return in exchange for taking on risk.
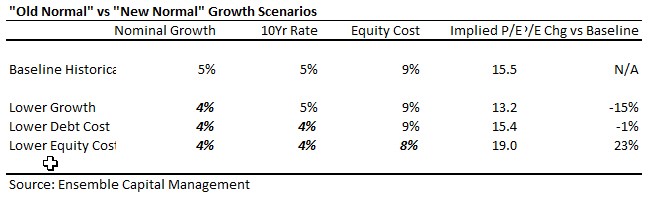
Last year we wrote a four part series about the risk of low growth. In Part 4, we showed how a 4% long term growth trend for the US economy (as we’ve seen over the last decade) could result in very different (or possibly unchanged!) valuation levels compared to the 60 year period prior to the financial crisis when economic growth was about 5%.
 In that post we went on to explain:
“What happens if the whole economy and corporate revenue growth slows from 5% to 4%? One thing that likely happens is interest rates decline… If you lower growth to 4%, the fair value PE for the market falls to 13.2… But if we assume [that] interest rates decline by 1% as well, then the fair value PE moves back up to 15.4.
But what about the equity cost of capital? Historically equity investors have demanded about 4% higher annual returns than debt investors in the same companies. In a low growth, low interest rate world, would equity investors still demand 9% annual returns, or would they be OK with the same 4% “equity risk premium” over now lower bond yields and thus price stocks to generate 8% returns? If after lowering growth and interest costs, we also lower the equity cost of capital to 8%, the fair value PE shoots up to 19x.”
What all of this means is that any time you see an investor say that a particular stock is worth a certain amount of money, whether they know it or not, embedded in this valuation is a forecast about long-term economic growth and the long-term level of interest rates.
In other words, it is impossible to be macro agnostic.
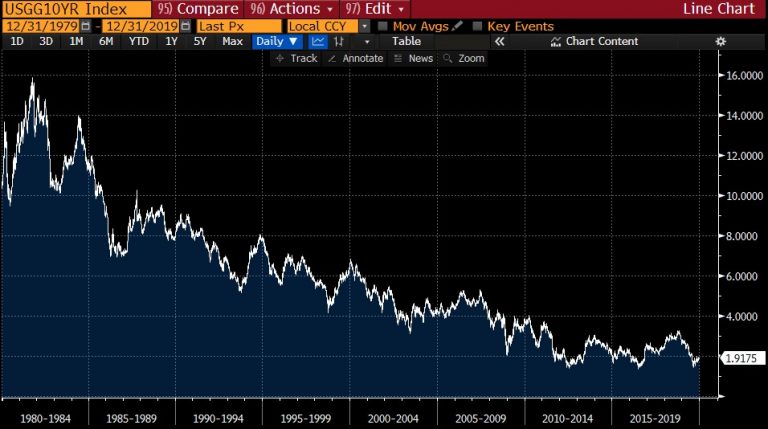
Even if you say “well, I just assume that future growth and interest rates will be the same as the average levels in the past,” the question becomes “what past time period?” Let’s look at the history of the 10-year treasury yield over the last 40 years. 40 years has got to be considered “long-term,” right?
 (Source: Bloomberg)
Based on this history, it appears that interest rates perpetually decline over time. Extrapolating this chart into the future suggests the 10-year yield will have a yield of -8% 40-years from now. But while we can observe mildly negative interest rates in some parts of the global economy, it seems very unlikely to us that the 40-year trend of declining interest rates will continue for the next 40-years.
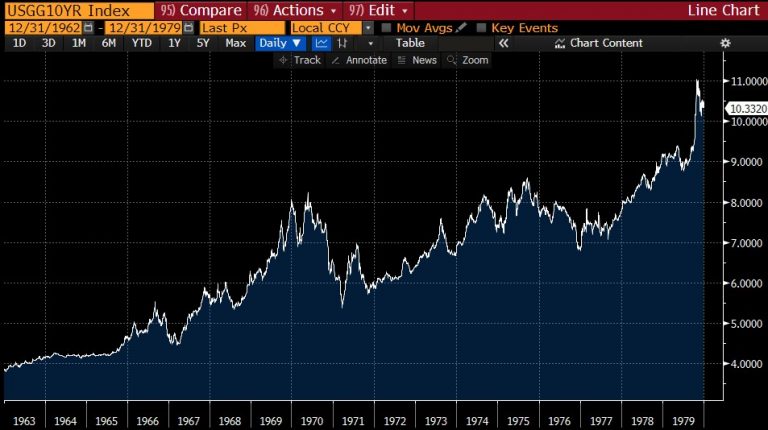
All we have to do is look at the prior 20-year period to see a very different trend:
 (Source: Bloomberg)
Based on this chart, you might excuse investors in the late 70s for believing that interest rates would exhibit a perpetually rising trend over the long term.
But of course, investors are not simply backward looking in making their forecasts. Investors as a group tend to assume that the future will look similar to the average of the past, rather than assuming that all trends will persist perpetually.
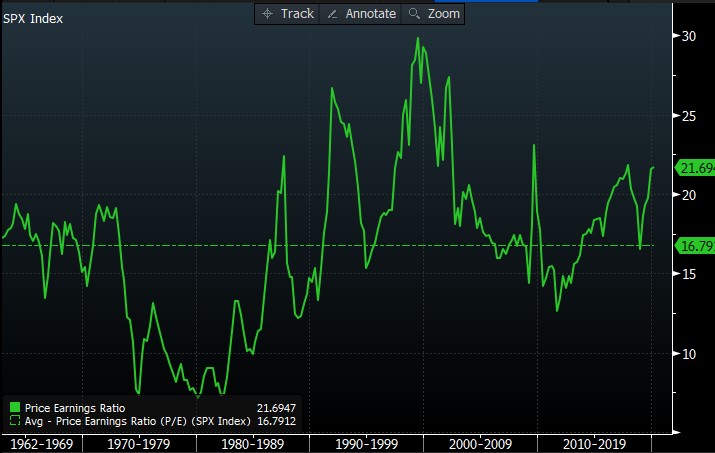
Here’s a chart of the trailing PE ratio of the S&P 500 over the past 60 years.
 (Source: Bloomberg)
Over the full time period, the trailing PE ratio (the price of the market compared to the past year’s earnings) has averaged 16.8x. Our calculation above suggested that the fair value PE should have been about 15.5x, but this is the forward PE ratio (the price of the market compared to the the coming year’s earnings). Since our calculations assume a 5% growth rate, the calculated 15.5x forward PE implies a trailing PE of 16.3x. So we can see that the actual average PE has almost exactly equaled the calculated average fair value of the market.
But the fact is that many investors think that low and even declining interest rates are here to stay for good. If you look at the PE ratio in the chart above, which shows as 21.7x, and convert it into a forward PE ratio you’ll see that it is very close to the 19x fair value we calculated if you assume that 4% GDP growth, 4% interest rates and just 8% annual equity returns is the new normal. It is true that GDP growth has only averaged 4% for the last decade, so this outlook may be pessimistic relative to the longer-term growth rate, but it isn’t an unreasonable point of view.
However, interest rates are not 4%. The 10-year yield is currently less than 2%. Yet despite yields being this low, it does not appear that equity investors believe they will persist. If you assume that the cost of risk-free debt will remain well below the growth rate of the economy, you end up implying that the stock market should trade at a much higher multiple than it ever has in the past. Remember just the shift down to 4% sent the fair value PE to 19x. You get almost nonsensical results if you use 2% and yet also assume growth stays at 4% or even rises back to 5%.
Yet investors have been valuing conservative stocks, ones with low volatility and higher than average dividend yields, or so called “bond proxies,” as if these ultra-low rates will continue for good. We’ve written about this in the past in posts here and here.
The amazing fact is that low volatility, “bond proxy” type stocks have done as well or better than more economically sensitive and volatile stocks even over the long term. This makes very little sense in a world where risk and return as supposed to be related and in fact this observation has been termed the low volatility anomaly as it flies in the face of classic understandings about how financial assets are priced.
Will this persist? It has gone on for a very long time. But note the chart above showing the 40 year trend of falling interest rates? Do you think they will continue falling for the next 40 years? If not, you should be acutely aware that the low volatility anomaly is very unlikely to persist and returns to low volatility stocks are likely to deeply disappoint investors despite the fact that low volatility investment products have been all the rage for years.
While interest rates have been falling persistently for 40 years, there has been medium term periods during which they have risen. So we can get a sense for how these sorts of stocks might perform during a period of rising interest rates.
The results are not pretty.
A couple years ago, Morningstar analyst Alex Bryan produced this outstanding analysis of the degree to which the performance of low volatility funds was being driven by declining interest rates. In his report, he showed this chart:
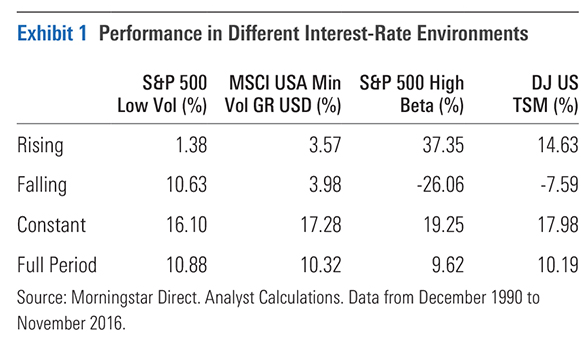
The S&P 500 Low Volatility index tracks low volatility stocks. The MSCI USA Minimum Volatility index is similar, except that it attempts to reduce the interest rate sensitivity of its performance in the way in constructs the index. The S&P 500 High Beta index is made up of the most volatile stocks in the market, while the Dow Jones Total Stock Market index just attempts to capture total market performance.
What you see in this chart is that over the full 25-year period that was examined, a period that saw the 10-year treasury yield decline from about 9% to 2%, the pure low volatility index outperformed high volatility stocks and the overall market. Yet the outperformance was only slight despite a huge decline in rates.
But look at the returns in Exhibit 1 during periods of rising rates that occurred during that 25 year period. The low volatility index returned just over 1% per year when rates were rising while the overall market returned over 14% per year and high volatility stocks returned an amazing 37% per year. While the MSCI Minimum Volatility index attempted to reduce the interest rate sensitivity of its low volatility strategy, the strategy only generated slightly better results than the pure low volatility strategy and still dramatically underperformed the overall market.
In this next chart from Bryan’s analysis, he shows the degree to which each of the indices have exhibited volatility (beta) and their sensitivity to interest rates.
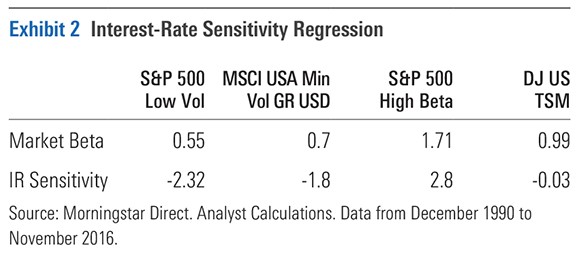
As you can see, the low volatility indices showed the low volatility that they promised. But this came along with very significant interest rate sensitivity. While the MSCI index that promises low volatility with less interest rate risk did show less of an impact from rate changes, it also was more volatile and still had significant interest rate risk.
The negative numbers for interest rate sensitivity for the low volatility indices means that on average they underperformed sharply when interest rates were rising. The positive interest rate sensitivity of the high volatility (beta) index means that it sharply outperformed during periods of rising rates. While the near zero interest rate sensitivity of the overall market illustrates that equity investors can diversify away interest rate risk as long as they don’t also demand low volatility.
If you own less volatile stocks because you like the low volatility and history shows they do just as well if not better than the overall market, then you need to recognize that you are making a bold macroeconomic forecast that interest rates are going to remain in a downward trend over the long term. In our view, while that’s not impossible, it seems highly unlikely.
What all this means is that it is impossible to be macro agnostic. Like it or not, you must have a view about where growth and interest rates go over the long term. Even if you don’t make this forecast explicit, if you buy investments such as low volatility funds, you are implicitly assuming that interest rates are going to keep declining.
The short-term economic cycle is nearly impossible to predict. But investments in equities are explicitly or implicitly based on large sets of forecasts about the future. The only value of a stock is the cash flow it produces in the future and so while history can be a great guide, it does not tell us for sure what is going to happen. Thus, we are forced to make investment decisions based around our explicit or implicit assumptions about the future.
At Ensemble Capital, we don’t like making forecasts about the future because we know how hard it is. But we also refuse to hide implicit assumptions from ourselves by pretending we can be macro agnostic. What history tells us is not that low volatility stocks outperform over the long term, but that low volatility stocks do well when interest rates are falling and do pretty terribly while interest rates are rising.
At least for us, we think assuming interest rates continue declining materially in the decades ahead is a very low probability outcome. We think investors in low volatility stocks, who are specifically seeking to reduce risk, need to fully appreciate the inherent risks of that strategy in the event the 40-year tailwind of falling interest rates comes to an end.
For more information about the positions owned by Ensemble Capital on behalf of clients as well as additional disclosure information related to this post, click here.
Past performance is no guarantee of future results. All investments in securities carry risks, including the risk of losing one’s entire investment. The opinions expressed within this blog post are as of the date of publication and are provided for informational purposes only. Content will not be updated after publication and should not be considered current after the publication date. All opinions are subject to change without notice and due to changes in the market or economic conditions may not necessarily come to pass. Nothing contained herein should be construed as a comprehensive statement of the matters discussed, considered investment, financial, legal, or tax advice, or a recommendation to buy or sell any securities, and no investment decision should be made based solely on any information provided herein. Links to third party content are included for convenience only, we do not endorse, sponsor, or recommend any of the third parties or their websites and do not guarantee the adequacy of information contained within their websites. Please follow the link above for additional disclosure information.
About The Author: Sean Stannard-Stockton, CFA
Sean is president and chief investment officer of Ensemble Capital and oversees the firm’s services for foundations and philanthropic families. Before joining Ensemble Capital, he was a member of a private client advisor team working with high net-worth individuals at Scudder Investments. He holds a BA in Economics from the University of California, Davis, the Chartered Financial Analyst designation, and is a Chartered Advisor in Philanthropy.
More posts by Sean Stannard-Stockton, CFA