This article is authored by MOI Global instructor Howard Punch, president and chief investment officer at Punch and Associates. Howard is an instructor at Best Ideas 2018, the fully online conference featuring more than one hundred expert instructors from the MOI Global membership community.
Investors are attracted to small caps because of the outsized performance historically achieved. However, based on how they typically allocate money, many investors often overlook the smallest companies which historically had the largest impact on the group’s outperformance. As of June 2017, approximately 3,600 companies traded on major U.S. exchanges.¹ Roughly 1,750 of those companies have a market cap of $1 billion or less, representing some $567 billion of market cap. Large, institutional investors pass over these smaller companies in favor of larger ones in which they can take more meaningful positions. We believe that this relative lack of attention and ownership of companies with a market cap of less than $1 billion creates an institutional “Blind Spot.”
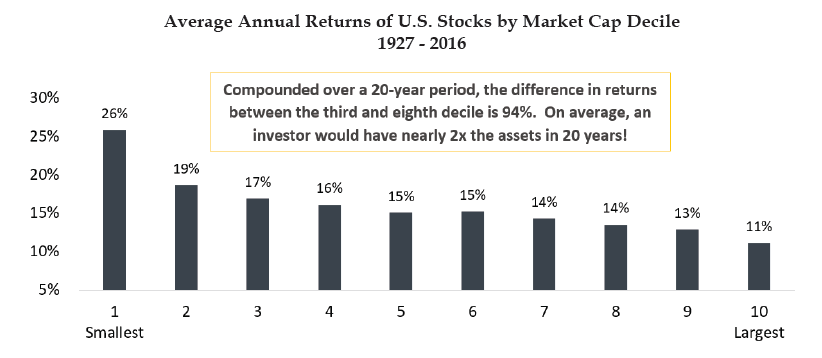
In our experience, we’ve found that many of these companies are often profitable, conservatively capitalized, and self-financing, so they are often ignored by sell-side analysts who have no incentive to offer research coverage. As a result, these companies are less well-known and their shares may trade less frequently. Most small cap investors fail to realize (as shown in the chart below) that as a group, the smallest companies have historically generated the highest returns. However, those sized companies are generally excluded from the average “name-brand” small cap portfolio.
“As to methods, there may be a million and then some, but principles are few. The man who grasps principles can successfully select his own methods. The man who tries methods, ignoring principles, is sure to have trouble.”
– Ralph Waldo Emerson
Focusing On the Blind Spot is Worth the Effort
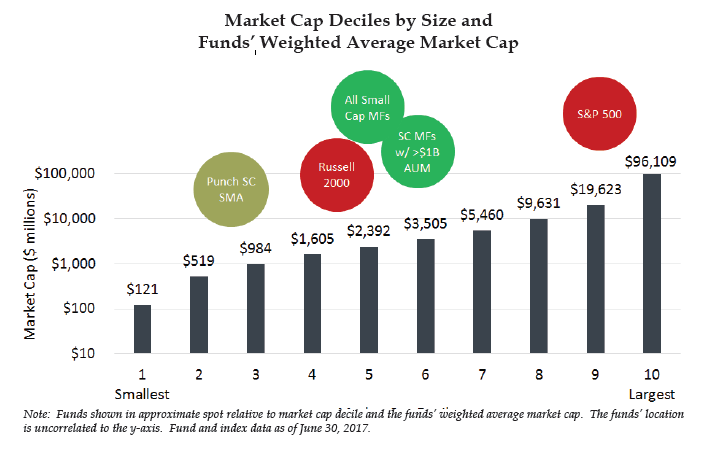
For the thoughtful investor willing to “take the blinders off” and gain exposure to “true small caps,” we believe a compelling opportunity persists. The performance of this largely ignored group of companies is often quite compelling. Over the past 90 years, the smallest decile of U.S. stocks has outperformed all other deciles – on both an absolute and a risk‐adjusted basis – providing an average annual return of 26% since 1927.
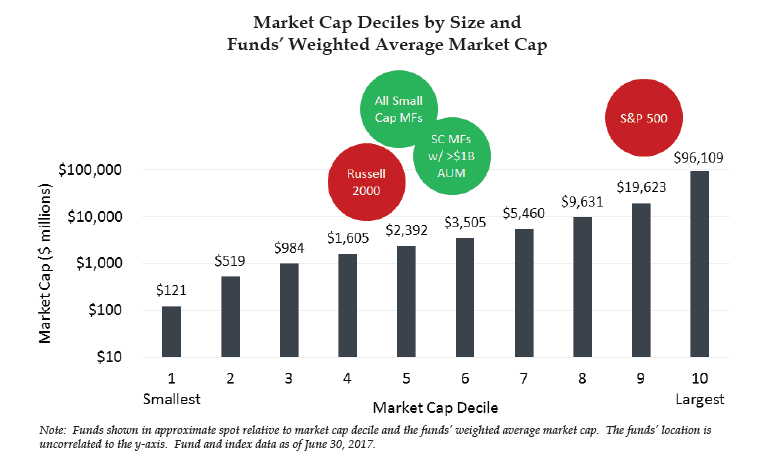
Today, the average size company in the first, second, and third deciles are $121 million, $522 million, and $1.0 billion, respectively.² This compares to $2.3 billion weighted average market cap for the Russell 2000 and $3.2 billion for the top 50 (by assets) actively managed small cap mutual funds.
It’s Becoming Harder to Access the Blind Spot
The most recognized small cap benchmark is the Russell 2000 Index. Yet, the benchmark and the ETFs that track it fail to provide investors significant ownership of the companies with the smallest market caps. Over time, that problem has increased, and investors are getting even less exposure to the smallest companies in the small cap universe.
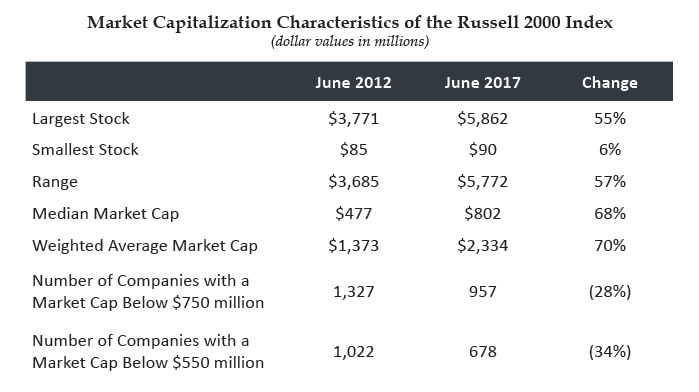
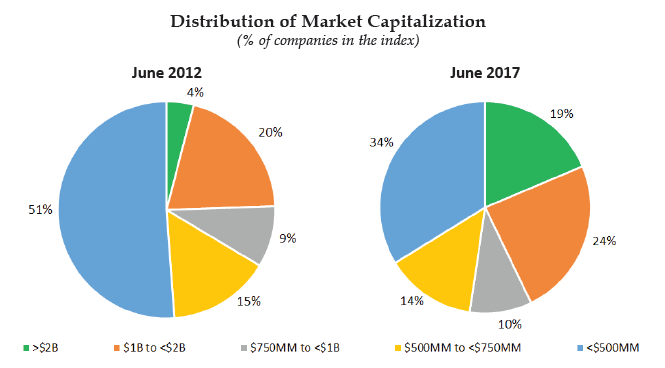
Over the last five years, the weighted average and median market cap of the Russell 2000 grew by over 65% and, as of June 2017, the median market cap was $802 million. Notably, the number of companies in the sub-$500 million market cap segment (roughly the cutoff for the bottom 20% of companies by market cap) shrank by 34%, and the number of companies in the $2 billion and greater segment grew by 363%. Because the index is market cap weighted, the overall exposure is skewed to the larger companies in the index. As of June 2017, the weighted average market cap of the index was approximately $2 billion, meaning 50% of money invested in the “small cap” benchmark is actually a blend between a small and midcap (SMID cap) offering.
A Passive Approach Arguably Fails in the Objective and Increases Risk
The rotation of funds to passive investing is well-documented. We are not surprised that, in the ninth year of a bull market where passive investing has dominated (delivered the best results), the drum beats are growing louder for active managers to hand over their Bloomberg terminals. We believe that in the least efficient areas of the market, an active approach has a higher probability of generating better risk-adjusted returns (with acknowledgements to our obvious bias). We believe better risk-adjusted returns come from companies that can compound value at an above market rate but also can provide good downside protection for when things do not work out as expected.
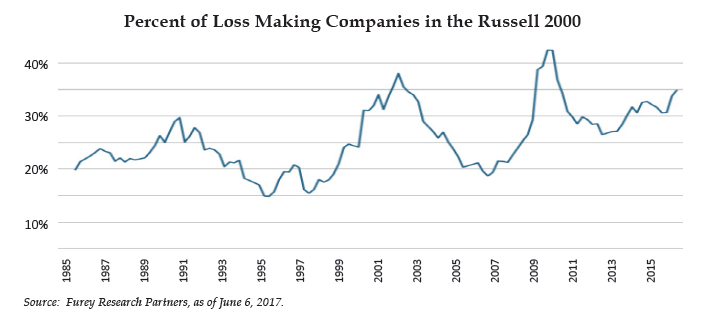
For investors seeking exposure to small caps through a Russell 2000 tracking ETF, the decreased downside protection over the last five years is a hidden risk. Excluding the technology bubble in the late 1990’s and the Great Recession of 2008-2009, the percentage of loss-making companies in the Russell 2000 Index is at a record high. In addition, the index has also seen a declining dividend yield and current ratio and a rising debt-to-equity ratio. Simply put, the average company in the Russell 2000 Index today is of lower quality than only a few years ago.
One would think that, based on diminished fundamentals and higher uncertainty around future profits, these companies would be assigned a lower valuation. In reality, the average market cap of a company in the benchmark has risen by more than 65% since June 2012 and a variety of traditional valuation metrics (P/E, P/CF, P/B) have increased. Today, a passive portfolio consists of companies that, on average, have a lower margin of safety and a higher valuation in addition to having fewer of the smallest companies that historically have generated the outsized returns.
“The inherent irony of the efficient market theory is that the more people believe in it and correspondingly shun active management, the more inefficient the market is likely to become.”
– Seth Klarman
Most Active Managers are Not Focused on the Blind Spot
There is an often‐overlooked aspect of small cap offerings by active managers that does not receive much attention: despite the fact that many professional investors closely track the Russell 2000 benchmark, many do so with a heavy bias toward owning the largest, most liquid stocks in the index.
Half the stocks in the Russell 2000 Index have market caps under $800 million, and many of these stocks share these distinguishing characteristics:
- under-owned by institutions
- under-researched by professional analysts
- unknown to most investors
- relatively illiquid
Investing in small, illiquid, under‐researched stocks takes more time and effort to do well. Moreover, the absolute size of these companies becomes prohibitive when investing large amounts of capital.
As of June 30, 2017, according to Bloomberg, 405 actively managed small cap mutual funds with more than $25 million in assets exist in the U.S. On average, these funds have a median market cap of $2.0 billion (2.5 times that of the benchmark) and a weighted average market cap of $2.8 billion (121% of the benchmark). Only 23% of these funds have median market caps below the benchmark, which represents less than 14% of total assets invested in all small cap mutual funds.
The average “asset gathering” small cap manager would rather piggyback on the long-term track record of the asset class, in our opinion, than do the hard work of owning the very vehicles that contributed most to this historical outperformance. Investing in small companies is simply not as scalable—or lucrative—as managing money in larger, more liquid companies.
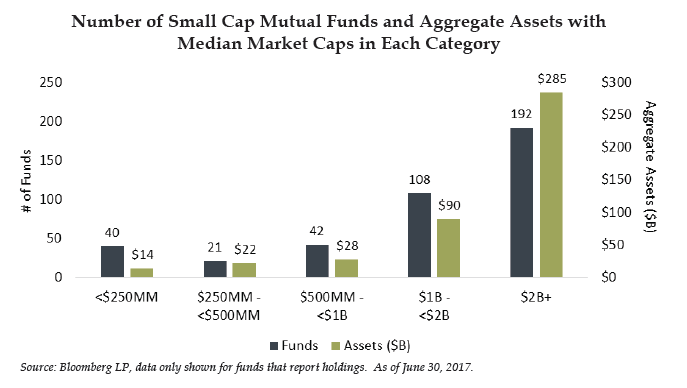
It is no surprise that small cap mutual funds with more assets also have portfolios with higher median market caps. For small cap mutual funds with more than $1 billion in assets, their average median and weighted average market cap are $2.5 billion and $3.3 billion, respectively. This is to say that half of the companies owned in these portfolios have a market cap that is greater than $2.5 billion, and half of the assets invested in these funds are in companies with a market cap greater than $3.3 billion.
A relatively small number of portfolio managers pay any attention to the smallest stocks in the index despite the fact that they represent a significant number of its constituents.
With the Russell 2000 benchmark having 50% of its capital tied to companies with a market cap of $2 billion or greater and the majority of small cap mutual funds with a similar weighting, it becomes easier to understand why we ask the question, “Is true small cap investing an institutional blind spot?” As seen below, one could conclude that indeed it is a challenge for institutions to capture exposure to what has historically been the best performing segment of the market, the companies in the bottom deciles in size as measured by market cap.
Members, log in below to access the restricted content.
Not a member?
Thank you for your interest. Please note that MOI Global is closed to new members at this time. If you would like to join the waiting list, complete the following form:
Disclosures: Punch & Associates is registered as an investment adviser with the U.S. Securities and Exchange Commission. Registration as an investment adviser does not imply a certain level of skill or training. This material is for informational purposes only and is not and should not be construed as accounting, legal, or tax advice. Punch & Associates is not qualified to provide legal, accounting, or tax advice, and accordingly encourages clients and potential clients to consult their professional advisers with respect to such matters. The information is provided as of the date of delivery or such other date as stated herein, is condensed and is subject to change without notice. Information regarding market returns and market outlooks is based on the research, analysis and opinions of Punch & Associates, which are speculative in nature, may not come to pass, and are not intended to predict the future performance of any specific investment or any specific strategy. This document does not purport to discuss all of the risks associated with any specific investment or the use of any strategy employed by Punch & Associates. Certain information contained herein may constitute forward-looking statements. Forward-looking statements are subject to numerous assumptions, risks, and uncertainties, and actual results may differ materially from those anticipated in forward-looking statements. As a practical matter, it is not possible for any person or entity to accurately and consistently predict future market activities. While Punch & Associates makes reasonable efforts to ensure information contained herein is accurate, it cannot guarantee the accuracy of all such information. Further, some information contained in this report may have been provided by or compiled based on information provided by third party sources. Although Punch & Associates believes the sources are reliable, it has not independently verified any such information and makes no representations or warranties as to the accuracy, timeliness or completeness of such information. Past performance does not guarantee, and is not indicative of, future results. All investments in the market are subject to a risk of loss.
About The Author: Howard Punch
Howard directs all research and investment initiatives at Punch & Associates. Howard honed his investment management skills the old fashioned way: by making a lot of mistakes. Starting his career in the early 80’s at Merrill Lynch in NYC and then as a retail guy in Minneapolis, it was normal practice to call clients with one stock at a time, state the case for owning it and hope for the best. Win, lose or draw, each pick would have to be re-visited with each client. The end result was a deep respect for risk, a large dose of humility and a risk-averse investment approach that anticipates what could go wrong before fantasizing about what could go right. After spending nearly 19 years at Merrill Lynch, Howard started Punch & Associates in 2002. A hopeless research addict and devout student of behavioral finance, Howard actively researches market anomalies and inefficiencies. Howard resides in Eagan, MN with his wife, Julie. He is a Magna Cum Laude graduate of Carleton College
More posts by Howard Punch