Always a pleasure to learn from Warren Buffett's insights.https://t.co/GreG9omzab
— Gautam Baid (@Gautam__Baid) March 29, 2019
The Acquirer’s Multiple: How the Billionaire Contrarians of Deep Value Beat the Market, es un libro muy básico sobre el deep value. Es el cuarto libro de Tobias Carlisle, fundador y gestor de Acquirer’s Fund, además de ser autor del famoso blog Greenbackd y de otros tres libros más como Quantitative Value, Deep Value y Concentrated Investing. Australiano de nacimiento, pero actualmente residiendo en Estados Unidos, en la actualidad Toby es uno de los referentes de la inversión deep value, activista y en situaciones especiales.
Cabe destacar que el blog su blog fue una fuente para sus dos primeros libros (Quantitative Value y Deep Value). Ahora, The Acquirer’s Multiple es un libro de apenas 159 páginas en donde se resumen y simplifican las ideas más destacadas de los libros anteriores de Carlisle. La premisa es la misma: ¿por qué las acciones desfavorecidas que pertenecen a compañías que presentan problemas temporales baten al mercado y a aquellas compañías de calidad?
Cuando una compañía infravalorada posee un negocio aterrador, malo o aburrido, a menudo todo lo que necesita es tiempo. Dado el tiempo suficiente, muchas empresas resultan menos atemorizantes, aburridas o malas como parecen al principio.
El autor responde a esta pregunta con una simple respuesta: regresión a la media. Es decir, las compañías que se han mantenido en crecimiento regresan a un punto donde se estancan y han perdido ese glamour que tanto desean los inversores; y las compañías desfavorecidas que nadie quiere, llegan a un punto en que salen de sus problemas y son atractivas para los inversores. Ojo, que Toby no menciona que uno no debe invertir en compañías con moats, sino que por el contrario, hay que saber identificarlas bien y comprender que tarde o temprano sus moats no son para siempre y regresarán a un punto no tan atractivo.
Destaca del libro la mención diferentes inversores value destacados que han invertido en este tipo de situaciones y que han obtenido rentabilidades que baten al mercado. Por ejemplo, tenemos los casos de un joven activista Warren Buffett que invertía en situaciones especiales, así como en situaciones deep value donde tomaba el control y aumentaba el valor de las empresas. También tenemos el caso de Carl Icahn durante la década de los ochenta, cuando empezó a ser reconocido por ser un corporate raider (tiburón financiero):
El plan de Icahn era simple: primero, adquirir una participación en una empresa infravalorada. La participación debe ser lo suficientemente grande como para llamar la atención de la gestión. En segundo lugar, presionar a la gestión para que venda la empresa. Al mismo tiempo, dejar que el mercado sepa que las acciones están infravaloradas al iniciar una proxy fight para obtener el control. Si la gestión no vende, se pone a la compañía “en juego” haciendo una OPA hostil.
También se menciona el famoso Acquirer’s Multiple, una fórmula acuñada por Toby la cual alega que es la que utilizan este tipo de inversores para identificar compañías infravaloradas, dejando atrás al famoso PER. La fórmula es sencilla:
Acquirer´s Multiple = Enterprise Value / Operating Earnings
De acuerdo con Toby, si encontramos una empresa con un Acquirer’s Multiple menor a 5, estamos ante una ganga. Y hablando de esta fórmula, el autor también dedica un capítulo a por qué esta fórmula bate a la famosa Fórmula Mágica de Joel Greenblatt. Además, para los inversores pasivos, también dedica unas breves hojas a cómo aplicar de manera automatizada esta fórmula.
En fin, el libro de una manera muy básica nos lleva a recorrer los principios del deep value, que implementado por Benjamin Graham hace más de ochenta años, ha ido evolucionando con el tiempo. Sin embargo, las bases siguen siendo las mismas: comprar una empresa con un margen de seguridad, a buen precio, con mucha caja, tener mentalidad de propietario, invertir en tu círculo de competencia (concentrarte en tus mejores ideas) y esperar a que el mercado haga su magia.
It is a pleasure to share with you a wide-ranging interview we conducted in New York in 2017 with William Green, author of The Great Minds of Investing and a former editor of Time Magazine. William also worked closely with Guy Spier on The Education of a Value Investor.
In the conversation with former MOI Global managing director Shai Dardashti, William Green touched on many aspects of what makes great investors different. Shai and William also spoke at length about the lessons of Guy’s book. Finally, William shared insights into some of the other investors profiled in The Great Minds of Investing.
Here is William on the role of luck in Howard Marks’ career success:

Members, watch the full interview and download the transcript.
This article is authored by MOI Global instructor Andrew Macken, Chief Investment Officer at Montaka Global Investments, based in Sydney, Australia.
In the hit TV series, The Marvelous Mrs. Maisel, Miriam “Midge” Maisel – married, mother of two from the Upper West Side of New York City – discovers a hidden talent for stand-up comedy. Her natural, unexpected wit creates twists and turns with laughter and tears for her audience.
So too is Mr. Market today making fun of global equity investors. 2018 was a year of rotations, corrections and volatility. The year rounded out with an overwhelming general bearishness with many believing more downside lay ahead. But, as with Mrs. Maisel, should we expect the unexpected from Mr. Market?
In the white paper that follows, our analysis shows that global equities have arguably become less risky, not more risky, over the last four years. And there remains plenty of opportunities to exploit for high-quality active fund managers.
Furthermore, we examine the idea that algorithmic trading is creating unusual geographic and inter-sector rotations. If it is true that the algos are causing Mr. Market to become increasingly erratic, this creates a double-edged sword for investors. On the one hand, non-fundamental moves in stocks create mispricings which can be exploited by discerning active fund managers. This is great news for the patient, long-term investor who can tolerate some short-run volatility. But it also means that short-run performance metrics are less meaningful.
Section I – Did Mr. Market Run Out of Steam Four Years Ago?
Over the last four years, global equities have delivered a real return of approximately zero… True or false?
Before you scream “false”, let us mount an argument as to why it may be more believable than you think.
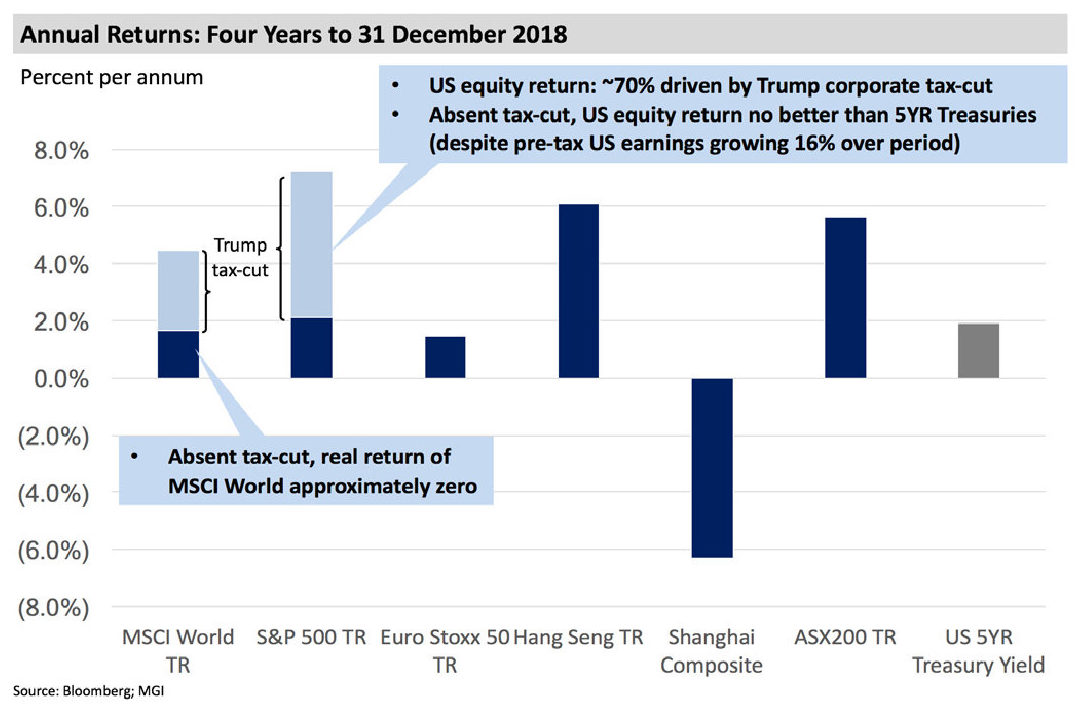
First, we observe that the MSCI World Net Total Return Index has delivered +4.5 percent per annum over the four-year period to 31 December 2018. This return is clearly above any global average rate of inflation suggesting real global equity returns have been positive over the period.
By far the most substantial contributor to the MSCI World’s return was the +7.2 percent per annum return generated by US equities – as measured by the S&P 500, in this case. Now, the US accounts for approximately 54 percent of the MSCI World Net Total Return Index, so this substantial return drove more than 80 percent of the total return of the MSCI World over this four-year period.
But what is sometimes forgotten is that US domiciled businesses benefited from a significant reduction in their corporate tax rate, from 35 percent to 21 percent, as part of President Trump’s famous Tax Cuts and Jobs Act of 2017. This reduction in the corporate tax rate effectively provided a one-time rebasing of US corporate earnings upwards.
We thought it might be interesting to consider what US equities may have delivered absent the Trump tax cut. Our analysis is simple in that, assuming a constant valuation multiple, we crudely deflate the US equity index by the degree to which US corporate earnings rebased upwards (which we assumed was 21 percent). We believe the results of our analysis are informative, notwithstanding its simplicity.
The analysis is summarized below which shows that approximately 70 percent of US equity returns over the last four years was driven by the reduction in the US corporate tax rate. Absent this tax cut, US equities would likely have delivered an average return of 1.9 percent per annum – exactly the same as the average yield of the five-year US Treasury Bond over the same period.
Now, upon adjusting the MSCI World Net Total Return Index for the Trump tax cut, the four-year annual return of +4.5 percent reduces to just +1.6 percent per annum. Arguably this return is in line with global inflation suggesting real global equity returns over the period have been approximately zero.
What conclusions should be drawn from the above?
First, proponents of passive index funds should send President Trump a Thank You card. Absent the US corporate tax cut, passive global equity returns over the last four years would have barely beaten inflation, as shown above.
A corollary here is that high-quality active funds management that can generate outperformance above average equity returns, or “alpha”, is worth a lot more to investors in a lower returning equity environment. By way of comparison, our global equity long-short strategy, Montaka, delivered a US dollar- equivalent return of 6.3 percent per annum, net of fees, over the three-and-a-half year period to 31 December 2018, despite an average beta of approximately 0.3.
Now, you might be wondering: why bother with equities at all? This is a valid question in light of the last four years of equity returns. Why take equity-risk to generate the return of a risk-free Treasury Bond? Of course, this risk/reward equation makes no sense – but this is what happened effectively over the last four years when we deduct the one-time benefit from the Trump tax cut.
To help make sense of the current situation, consider the following thought experiment. You can buy one of the following two securities:
Security A: an equity in a global monopolist growing revenues organically at 15-20 percent per annum that can be purchased today at a forward P/E ratio of 16x; or
Security B: a ten-year Treasury Bond that grows its coupon at 0 percent and can be purchased at a price-to-coupon ratio of 40x.
Which is more appealing? We think Security A by a mile – and that is why we own Facebook (Nasdaq: FB) in our global portfolios today.
Let us now take the thought experiment one step further. Let’s say we buy Facebook today and we wake up in five years’ time with a total return on our position of just 1.6 percent per annum – equivalent to what the MSCI World delivered over the last four years, excluding the Trump tax cut. The implication here is that, absent a significant downgrade in earnings expectations, the P/E multiple in five years’ time must have become around 40 percent cheaper. This would mean that Facebook would be trading at less than 10x forward P/E ratio! Such a seemingly absurd valuation multiple for such a high-quality business gives us comfort that our return on this investment will likely be materially higher.
The key idea here is as follows: as earnings grow without commensurate growth in total shareholder return, then equities are essentially becoming cheaper, absent some material change to the trajectory of future growth or cost of capital.
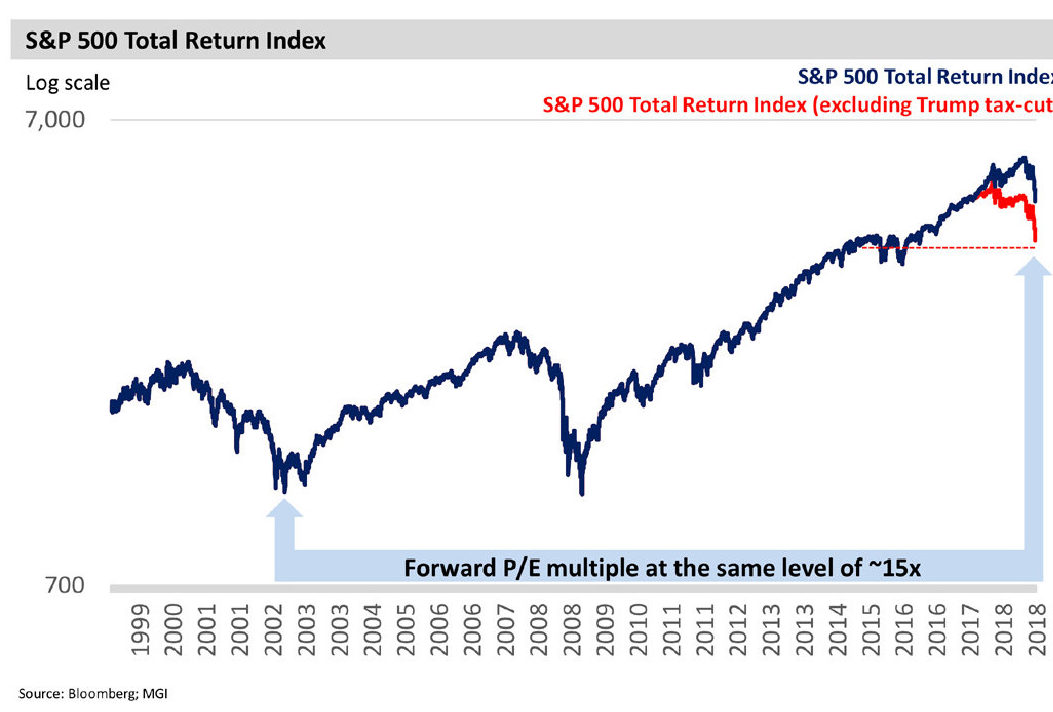
Over the last four years, global equities have effectively drifted sideways (absent the one-time Trump tax cut); but pre-tax earnings have been increasing! In the US, for example, S&P 500 pre-tax earnings have increased by 16 percent over the last four years. Said another way: global equity markets have actually become cheaper, or less risky, over the last four years.
Now, you certainly would not think that stocks have become less risky if you read any financial press. The conventional wisdom is that equities are heading for a prolonged “bear market” – perhaps like what was observed at the beginning of the century. Between 2000 and 2002, the S&P 500 Total Return Index roughly halved. But it is worth noting that the forward P/E ratio of the S&P 500 today is the same as where it was at the bottom of the 2002 bear market – and roughly half of where it was at the top, in the year 2000.
We have no idea where global equity markets are going to go in 2019 or beyond. But we do know that, as stock prices fall, the probability of higher future investment returns increases. And in the second half of 2018, stock prices fell.
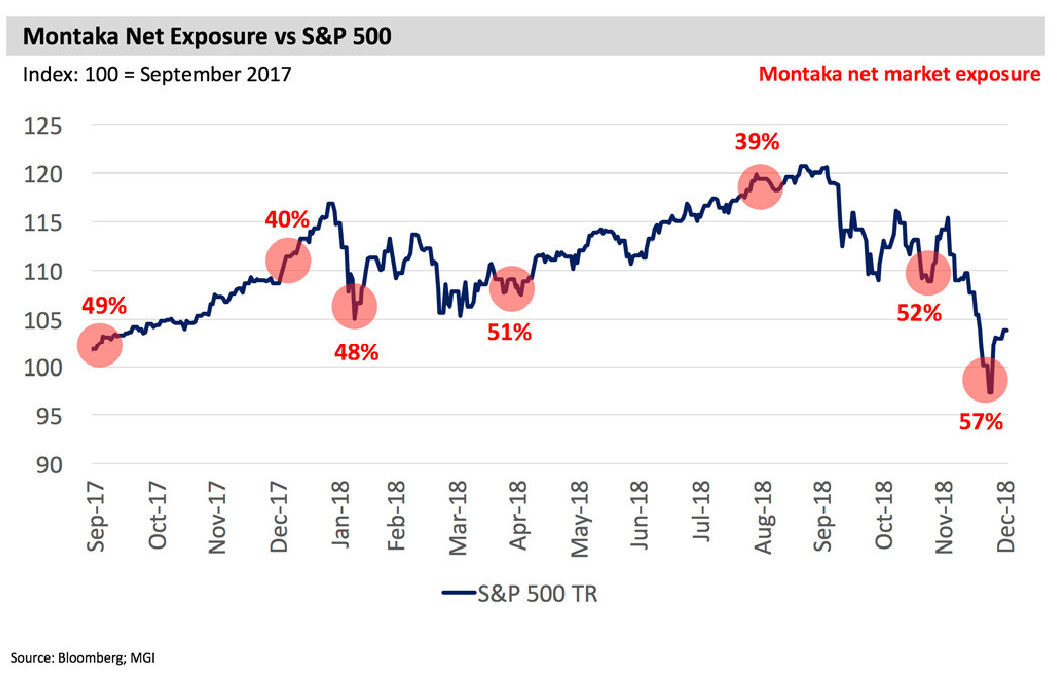
The benefit of a “variable net” long short strategy, such as Montaka, is that the portfolio’s net exposure to the overall equity market can be varied according to prospective risk/ reward profile. This is achieved through some combination of increasing long exposure and/or covering short exposure. As can be observed by the chart below, we increased Montaka’s net exposure as stock prices became cheaper in the fourth calendar quarter of 2018. And should stock prices fall even further, investors should expect Montaka’s net exposure to increase yet again.
One final point needs to be made here. While the focus of this Whitepaper has been on aggregate equity markets, readers should remember that we do not invest in markets. We invest in individual high-quality businesses when we believe they are materially undervalued. And we short businesses which are structurally challenged, mis-perceived and overvalued. While it is the bottom-up process of identifying new long and short opportunities that is the primary driver of changes in Montaka’s net market exposure, we also exercise top-down judgment to determine where the portfolio’s net exposure should be at any point in time. This top-down judgment is informed by analyses such as those contained in this Whitepaper and is typically consistent with what our research team is observing on a bottom-up basis.
To conclude this section, our message is that it is far from clear that we are heading into a prolonged bear market. Of course it is possible. But our analysis suggests the probability of such a prolonged bear market has actually reduced since four years ago. And should the market continue to move sideways, high- quality active funds management should be able to exploit plenty of mispriced stocks to generate superior returns relative to their passive counterparts.
Section II – Is Mr. Market Becoming More Erratic?
In 2018, global equity investors experienced a return of market volatility. This is not a bad thing – after all, it is during periods of market volatility that equity mispricings tend to be at their highest. And mispricings are the core ingredient for active managers to generate outperformance, or alpha, over time.
But in 2018, global equity investors were not just faced with volatility, they were faced with unusual geographic and inter- sector rotations. Many of these moves, it must be said, appeared non-fundamental in nature.
It is impossible to know what causes short-run moves in equity prices. In recent months, it was interesting to listen to an interview by Stanley Druckenmiller. His observations of current market conditions in the context of his 35 years’ experience as a top professional investor struck a chord with us.
“The algos have taken all the rhythm out of the market and have become extremely confusing to me.”
Druckenmiller reflected on a dynamic he observed in 2018. Interestingly, similar observations had been made on multiple occasions during the year inside the Montaka research team. Unlike Druckenmiller, however, we had no sensible explanation for what we were observing.
“The pharmaceuticals, which you would think are the most predictable earnings streams out there, so there shouldn’t be a whole lot of movement one way or another. From January to May, they were massive underperformers. In the old days, I would look at that relative strength and I’ll go: ‘this group is a disaster’… They were the worst group of any I follow from January to May. And with no change in news, and no change in Trump’s narrative and, if anything, an acceleration in the US economy, which should put them more toward the back of the bus than the front of the bus because they don’t need a strong economy, they have now been about the best group from May until now [September]. And I could give you about 15 other examples. And that’s the kind of stuff that didn’t used to happen.”
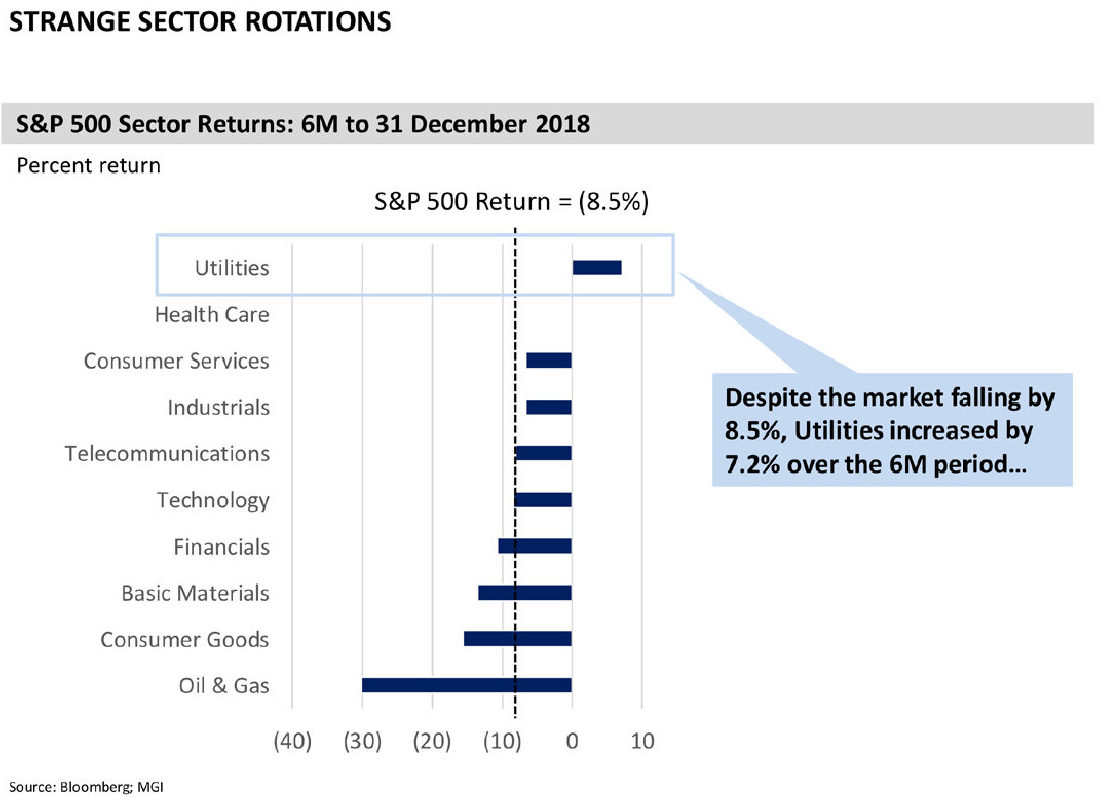
Now, we do not know for sure that algos are the source of the dynamics being observed. But we do know for sure that these dynamics are being observed. We recently witnessed significant outperformance of Utilities at a time when interest rates were increasing – a nonsensical move for sectors which are often treated by investors as “bond substitutes”.
So what to make of a global equity market that can be characterized as having pockets of non-fundamental moves in prices at different times?
First, this is great news. Non-fundamental moves in stocks’ prices create mis-alignments between price and intrinsic value which can be exploited by active managers who are sharply focused on such mispricings.
But there are other corollaries as well. For instance, how meaningful is short-run investment performance in the current environment? Here is the thought experiment: imagine a magic investment manager who always bought stocks at prices below their intrinsic value. By definition, this manager must outperform the market in the long run. But what about in the short run? Given the non-fundamental moves in groups of stocks at different times, this manager will experience periods of short-term volatility and underperformance. Imagine a scenario in which an undervalued business is purchased – only for that business to subsequently experience a temporary, non- fundamental move to the downside. A continuation of a diligent, well-thought out investment process may appear fruitless in the short-run due to these non-fundamental stock price swings.
Or take portfolio risk management. Many investors – especially institutional investors – require investment managers to decisively reduce portfolio risk during periods of draw-down.
The simple logic can be understood as follows: in periods of draw-down, the market is signalling to the manager that the portfolio positioning is inappropriate for the current market conditions. But how valuable is this market signal in a market construct which includes non-fundamental moves in different pockets in the market at different times?
This feedback from the market is something that investors, including Druckenmiller, used to rely on as some form of confirmation of one’s investment thesis. Under the current market conditions being observed, investors and risk managers alike need to reconsider the weighting they apply to such market signals. And arguably, the importance of thoughtful and accurate fundamental analysis, combined with a disciplined investment framework, has only increased in this new market environment.
Members, log in below to access the restricted content.
Not a member?
Thank you for your interest. Please note that MOI Global is closed to new members at this time. If you would like to join the waiting list, complete the following form:
Disclaimer: This document was prepared by Montaka Global Investments LLC. This document was approved by Montgomery Investment Management Pty Ltd, AFSL No: 354 564 (Montgomery) the trustee of the Montaka Global Fund. MGIM Pty Ltd (MGIM) is the Investment Manager of the Montaka Global Fund and an Authorised Representative (AR No: 001007050) under the AFSL of Montgomery. Montaka Global Investments provides research services to MGIM. The information provided in this document does not take into account your investment objectives, financial situation or particular needs. You should consider your own investment objectives, financial situation and particular needs before acting upon any information provided and consider seeking advice from a financial advisor if necessary. Future investment performance can vary from past performance. You should not base an investment decision simply on past performance. Past performance is not an indicator of future performance. Investment returns reviewed in this document are not guaranteed, and the value of an investment may rise or fall. This document is based on information obtained from sources believed to be reliable as at the time of compilation. However, no warranty is made as to the accuracy, reliability or completeness of this information. Recipients should not regard this document as a substitute for the exercise of their own judgement or for seeking specific financial and investment advice. Any opinions expressed in this document are subject to change without notice and MGIM is not under any obligation to update or keep current the information contained in this document. To the maximum extent permitted by law, neither MGIM, nor any of its related bodies corporate nor any of their respective directors, officers and agents accepts any liability or responsibility whatsoever for any direct or indirect loss or damage of any kind which may be suffered by any recipient through relying on anything contained in or omitted from this document or otherwise arising out of their use of all or any part of the information contained in this document. MGIM, its related bodies corporate, their directors and employees may have an interest in the securities/instruments mentioned in this document or may advise the issuers. This document is not an offer or a solicitation of an offer to any person to deal in any of the securities/instruments mentioned in this document.
In-Depth Investment Thesis Update on Rosetta Stone
March 28, 2019 in Equities, GARP, Ideas, Information Technology, Letters, North America, Small CapThis article by MOI Global instructor John Lewis is excerpted from a letter of Osmium Partners, based in Greenbrae, California.
Rosetta Stone Inc.[1], together with its subsidiaries, provides technology-based learning products in the United States and internationally. It operates through three segments, Enterprise & Education, Literacy and Consumer. The company develops, markets, and supports a suite of language-learning, literacy, and brain fitness solutions consisting of software products, Web-based software subscriptions, online and professional services, audio practice tools, and mobile applications. Rosetta Stone’s current market capitalization is approximately $513 million. The company generated $174 million in sales for the LTM ending December 31, 2018. (RST is a holding across all funds.)
Rosetta Stone (RST) stock popped from $15 to $21 in March on strong earnings guidance. At $15.30, RST was valued at only 5.7x 2021 operating cash flow guidance with 50% compounded annual operating cash flow growth. RST guided to operating cash flow growth of $19 million in 2019, $37 million in 2020, and $57 million in 2021, and we think 2022 will be near $75+ million a year. The market cap to start March was $325 million. Valuing RST at a 10x multiple of operating cash flow on 2021 plus net cash balance is $29.00 per share. Rosetta’s business model has transformed to a 100% SaaS based software company with currently over 5,000,000 paid subscribers and projected to grow by 700,000 to 1 million new subscribers per year. We think by 2021 it will be worth $40+ per share (we have a cost basis around $9). RST is currently valued at 2.0x sales, whereas at a public comp valuation of 7x RST would be worth $60+ per share.
Members, log in below to access the restricted content.
Not a member?
Thank you for your interest. Please note that MOI Global is closed to new members at this time. If you would like to join the waiting list, complete the following form:
Certain factual and statistical (both historical and projected) industry and market data and other information contained herein was obtained by Osmium Partners from independent, third-party sources that it deems to be reliable. However, Osmium Partners has not independently verified any of such data or other information, or the reasonableness of the assumptions upon which such data and other information was based, and there can be no assurance as to the accuracy of such data and other information. Further, many of the statements and assertions contained herein reflect the belief of Osmium Partners, which belief may be based in whole or in part on such data and other information. The analyses provided may include certain statements, assumptions, estimates and projections prepared with respect to, among other things, the historical and anticipated operating performance of the companies. Such statements, assumptions, estimates, and projections reflect various assumptions by Osmium Partners concerning anticipated results that are inherently subject to significant economic, competitive, and other uncertainties and contingencies and have included solely for illustrative purposes. No representations, express or implied, are made as to the accuracy or completeness of such statements, assumptions, estimates or projections or with respect to any materials herein. Actual results may vary materially from the estimates and projected results contained herein. Past Osmium performance is not indicative of future results. Osmium takes concentrated positions. Osmium Partners disclaims any obligation to update this letter. A portion of the Partnership’s assets may from time to time be invested in securities that have limited liquidity. The Partnership’s investment strategy is to make concentrated investments in what it views as its best ideas. The Offering Memorandum and Limited Partnership Agreement offers a comprehensive overview of the risk factors involved in investing with Osmium Partners. The information contained herein is provided for informational purposes only. This is not an offer to sell, or a solicitation to buy, limited partnership interests in Osmium. An investment in Osmium is not suitable for all investors. Graphs/charts are provided for illustrative purposes only and should not be relied on to form an investment decision. Stocks mentioned in the newsletter do not constitute a recommendation to buy or sell the individual securities.
Our article in MOI global. @manualofideas https://t.co/dUrmm8T09O
— Viraj Mehta (@virajmehta16) March 25, 2019
High cash balances can indicate at least 4 positives:
(1) Firm has been able to generate high cash levels
(2) Firm has not needed to deplete cash
(3) Firm is conservative in maintaining high levels of liquidity
(4) Firm potentially unwilling to commit to projects with low returns— Alex Gilchrist (@alexjg888) March 26, 2019
This article is authored by MOI Global instructor Rohit Chauhan.
Value investing has traditionally been associated with words like “bargain” or “cheap”. It was originally associated with low P/E or price-to-book ratios, companies selling for less than liquidation value, and so on. As the thinking evolved, the definition changed to a discount to intrinsic value (or other measures of value).
The common thread in all these approaches was an emphasis on a bargain price to value – irrespective of how value was computed. This mode of thinking is now becoming outdated.
In recent years, the success of various social, platform, or network-effect companies means that traditional measures of value are no longer enough. It is important for value investors to update their mental models and consider alternative approaches to estimating value.
P/E of 100: Is it value?
In the recent years, we have had companies like Amazon, Netflix and others which have traded at nose bleed valuation for a very long time and refused to correct or revert to any sort of mean valuations.
If you are a value investor, what should your reaction be to the success of investors who buy and hold such seemingly overvalued stocks?
I know what the first objection is to this line of thinking – The success of these investors is just dumb luck. These guys are not really practicing value investing, but a form of momentum investing. It is just that momentum has lasted for five or more years in some cases, and sooner or later this bubble would burst.
My counterpoint: Sure, that is possible, but what if this bubble has lasted for 10-15 years in some cases. Will you still just wave away these anomalies and label them as flukes?
I prefer to take a different approach. There is no religious debate to this in my mind – if something has worked for 3+ years in the stock market, then it is worthy of investigation. A lot of bubbles and temporary fads usually get washed out in two to three years and so three years is a good cutoff point to start the analysis.
What can one learn from this oddity where some companies manage to sell at seemingly high valuations for a very long time.
New business model or value capture
I think the first point to look for is whether there is a change occurring in the business model/ design, wherein, due to changing customer needs and priorities, a new type of design is now more suited to meet them more profitably.
I would recommend reading the book Value Migration, which goes over this concept in quite a bit of detail. The main point is that changing customer needs and priorities cause a change in the business design best suited to meet them. Companies which can identify and develop a business model to meet this new reality are able to accrue a lot of value for their shareholders.
For example, a rise in income levels has caused the retail consumer in India to now value quality, brand image and convenience in addition to price. As a result, companies which can meet these new set of needs have been able to create a lot of value.
It is easy to see this phenomenon around us – Bathroom fittings, automotive batteries, garments etc. Some of these products were commodities in the past, sold largely based on price. However, increasing consumer purchasing power has meant that priorities have shifted beyond price.
Companies which have been able to adapt their business model to deliver on these new priorities of brand, quality and convenience in addition to price have delivered exceptional returns.
Example: Cera Sanitaryware, Amara Raja Batteries, Astral Poly Technik, etc., where the companies appear to be overpriced based on their recent earnings, but have a lot of potential runway in their target markets.
Opportunity size with durability
It is not sufficient to be able to meet the changing needs of the consumer, better than competition. For starters, the opportunity size should be large so that the company can grow for a long time.
This is a major advantage of the Indian markets over almost all other foreign markets. Even niches in India have a market size running to millions of consumers and hence a company with a good business model can grow for years to come.
Asian paints ltd is one such company which started out as a small paint manufacturer in the late 1980s, but has grown consistently since then and delivered a CAGR of 35+% since its IPO.
An additional point to keep in mind is the need for the company to develop a durable competitive advantage. Let’s take the case of the telecom industry in the early 2000s. The need for communication and mobile telephony was recognized by a few companies such as Airtel in the late 1990s and these companies moved in quickly to satisfy the need.
The market size was in the 100s of millions and most of the telecom companies were able to scale rapidly. However, the edge or competitive advantage turned out to be transitory and as a result after a few years of high profitability, we soon had a lot of price based competition. As a result, by 2007-08, most companies were losing money and have not created any value since then.
In such cases seemingly overvalued companies were truly overvalued.
Kings of their domain
A productive area for finding multi-baggers is in the micro-cap space, where the company operates in a niche and is growing rapidly as its business model is uniquely suited for that niche. In addition, the niche is large enough for the company to grow for a long time, yet not so big that it attracts large competitors initially.
There are a few examples which come to mind – Think of air coolers a few years back (Symphony), CPVC pipes (Astral Poly) or various niches in pharma and information technology.
A small company can develop a unique set of skills for this specific segment and can dominate and grow within the segment for a long time. In addition, as the niche is not large initially, it does not attract much competition till it reaches a certain size.
However, by the time the niche is big enough to catch the attention of larger companies in the overall space, it is too late as the specific company has established a dominant competitive position and cannot be dislodged.
A lot of these companies appear to be overpriced after they started growing, but this ignores the possibility of above average growth and a dominant position for the company.
Platform businesses
This is good note on what is a platform business, and Modern Monopolies is a good book on this topic.
I do not have an example in the Indian markets but will try to explain this using the example of a well-known US company. Its 2004 and a well-known company called google decides to launch its IPO at a then-P/E of around 65x. A cursory look shows the company to be grossly overvalued and as a result most value investors give it a pass.
The company has since then delivered a return of around 23% p.a and I am sure this qualifies as a great return. So why did a company which appeared so overvalued turn out to be a 20-bagger.
My own understanding is that this result came about from multiple factors. To begin with, the company operates in a winner take all kind of a market where the no.1 company tends to dominate and capture almost all its value. Once google had a 60%+ market share, network effects kicked in and the company just kept getting more dominant in the search space.
Once this base was built, the company extended it to other platforms such as mobile where the next leg of growth has kicked in. These types of companies also have a very low marginal cost of production and hence any growth beyond a threshold, drops straight to the bottom line.
This however does not explain fully the reason behind its success – We have a management who in the words of Charlie Munger, are intelligent fanatics and have the capacity to suffer (as referenced by Thomas Russo). As a result, they have continuously invested in long term ideas (called moonshots) even if it meant losses in the near term. You tube, android etc which are now bearing fruit were a drain on profits at one point of time.
Such companies usually appear overvalued in the early stages of growth. Another similar company was Facebook.
A point of caution: For every successful platform company, there are at least ten pretenders that destroy value. So, it is not easy to identify such companies ex-ante.
Capacity to suffer
This is a term used by Thomas Russo (see the talk here) to describe companies which are capable and willing to make investments in the business for the long term, even though it penalizes profits in the short term.
In most cases, due to market pressures, companies are not willing to hurt short term profitability to build the business for the long term and hence the few companies which are willing to do so, appear to be overvalued due to depressed profits.
The quintessential example of this is Amazon. The company has constantly re-invested its profits into new businesses suppressing near term profits. The company re-invested profits from its retail business into expanding its logistics operations and the cloud business (AWS). The AWS business has since then achieved scale and now contributes to a substantial portion of its operating earnings. The company continues to make investments in high ROI projects which build value but suppress the near term earnings.
A name closer to home is AIA engineering. The company is a global leader in the grinding media space for the mining, cement and Power industry. The company has developed chrome based grinding media which is superior in performance to the traditional Forged media used in these industries.
To enter new accounts, the company has resorted to underpricing its products to show value of this new technology to its customers. Once established, the company normalizes the pricing with the customer.
The result of this approach is that the near term profitability of the company gets suppressed in the seeding phase with new customers. However, once a customer is acquired, the lock-in is very high. In other words, the company is operating like the SaaS providers in the software space – incur high CAC (customer acquisition cost) to acquire customers with high LTV (life time value).
In all these examples, companies are incurring high upfront costs to build value for the long term. The net result is that valuation of the company looks optically high in the initial phase of this build out.
Rate of change matters
Let me introduce another concept – business clock speed, which I read about here. This is the rate at which a business is changing. For example, the rate of change in the social media business is high and conversely there are business such as paints where the rate of change is low.
I think it is obvious that businesses with low rate of change can create a durable competitive advantage for the long term and hence a seemingly high price turns out to be cheap. Think of HUL or Nestle as an example, which have created large value for shareholders despite seemingly high valuations all the time.
Members, log in below to access the restricted content.
Not a member?
Thank you for your interest. Please note that MOI Global is closed to new members at this time. If you would like to join the waiting list, complete the following form:
Jack Ayer, emeritus professor and former bankruptcy judge, recommends his top bankruptcy books… https://t.co/dSIPY9Xv9a via @five_books
— Chris Mayer (@chriswmayer) March 25, 2019
The Art of the Sale
March 25, 2019 in Asian Investing Summit, Commentary, Equities, Letters, Portfolio Management, Risk Management, TradingThis article is authored by MOI Global instructor Viraj Mehta, Fund Manager of Equirus Long Horizon Fund, based in Mumbai, India.
Investing includes many aspects, such as scouting for ideas, screening them, research (which calls for scuttlebutt, or speaking to various stakeholders of a company), valuation, portfolio allocation, and efficient execution of trades (buying and selling). Most investment-related writing is devoted to screening, research, and the valuation part of investing — aspects that are much more objective and scientific in nature. On the other hand, portfolio allocation and execution, especially selling, involve more subjectivity. Lesser material is available on the art of selling. Even media discussions focus more on research and buying. Experts offer buying tips but rarely speak about the stocks they have sold.
The idea of holding on to investments for the long term, especially when a company’s operational performance meets or exceeds expectations, is very attractive. But as most experienced investors know, not all companies perform as expected for extended periods of time. Real businesses are affected by domestic as well as global economic cycles, government policy actions, commodity and currency volatility, trade wars, corporate actions, and a lot more. While most businesses most are susceptible and some are resilient to adverse climates, a very few are antifragile (those that become stronger during bad times). In such times, it is important for the investor to have a framework that enables them to take calibrated actions.
Selling is as important, if not more, than research and buying. (Please note this is not about short selling, which is a completely different ballgame.) Apart from personal exigencies, there are many reasons for an investor to sell stocks in a portfolio.
1) Front-ended returns: Sometimes, the investment thesis plays out faster than expected, leading to stocks running up much faster than expected. Especially during bull markets, some stocks take off as soon as one buys them. Price starts running far ahead of fundamentals and within a matter of a weeks, months or quarters, the stock is up 50% or 100% or even more in some cases resulting in significant overvaluation. The risk-reward ratio at that price might become unfavourable leading to price or time corrections. Selling and deploying in a better alternative makes a lot of sense at these junctures.
2) Wrong investment thesis: Even though an investor has put in serious amount of work for researching an idea, the initial thesis sometimes turns out to be wrong. Any investment decision involves making a few assumptions about the company’s future performance and/or assigning probabilities to an event/trigger. An investment thesis should be thought of as a three-legged stool. If any one of the legs is broken, the stool cannot stand. Investors should carefully evaluate the new circumstances and rationally decide the fate of that investment. Often, it saves lot of money to humbly accept a mistake and sell rather than rationalize and hold.
3) Adverse changes to business economics: Businesses keep changing and evolving due to many dynamic factors. These factors can be changes in general business environment, technological disruptions, political actions or regulatory changes. These changes sometimes lead to deterioration of business economics and the ability of a business the earn decent returns on capital goes for a toss. When such developments occur, investors should revisit their original thesis and evaluate it critically, without being influenced by various psychological biases (especially sunk cost fallacy and price anchoring). Selling might be the best option (even at a loss) in most of these cases.
4) Adverse corporate actions: Importance of management actions cannot be emphasized enough during an investment journey. Management decisions can make or break an investment thesis. Bad capital allocation decisions, unfair treatment of minority shareholders, aggressive accounting practices, etc. are very clear signals pointing towards exit.
5) A turn in business cycle: Many businesses are cyclical. When these businesses do well over a period of 3-5 years, the investor should become very vigilant. Good economics attracts capital. As capital comes to the industry, the supply increases much faster than the demand which leads to deterioration of the business economics. Often, market reacts quickly in such cases and prices slide down very fast. An investor should always keep an eye on which leg of the cycle business is in. Holding a business through a downcycle can be very painful.
6) A better opportunity arises: Capital is limited for most of us and so, it must be used very judiciously. Capital must always be allocated to the best opportunities available. Whenever one is fully invested, and a better opportunity comes along, it is logical to replace the least attractive idea in the portfolio with the new one. Having said that, one should be careful before letting in any new idea. An investor is (ideally) much more familiar with his present investments than with a newer one. A new idea should only be included in the portfolio when it presents a significantly better risk-reward proposition than an existing stock in the portfolio.
Investments are like motion pictures rather than still photographs. Business dynamics keep evolving for better or for worse over time. An investor’s job is to keep a tab on these developments. They should remove the stocks with deteriorating fundamentals and hold on to or add to the ones that are on course or improving. In other words, the investor should water the flowers and cut the weeds.
At the same time, investors should remember that business fundamentals do not change as fast as share prices. There will be long periods of time when there will be no actionable insights. Such periods may last for a few quarters or even for a few years. These are the times when one needs to stay patient, confident, alert, and wait for the market to correct the mispricing.
Investors should also bear in mind that stocks may sometimes go up, for the right or wrong reasons, after you have sold them, especially in bull markets. It should not bother them. Mistakes will be made on both sides of the trade. There will be pain as well as learnings. But rather than being bogged down, investors should stick to a sound investment process which over the long run will produce satisfactory results.