This article is authored by Paul Perrino, portfolio manager at Ensemble Capital Management, based in Burlingame, California. Visit Ensemble’s Intrinsic Investing website for additional insights.
This is Part 6 of our series on position sizing. Part 1 provided insights into the number of stocks that should be held in a portfolio. Part 2 discussed the various stages of research and how that should be taken into consideration when building out your portfolio. Part 3 explained how conviction plays a role. Part 4 elaborates on conviction and how we turn a qualitative assessment into a quantitative input. And Part 5, brings it all together into a weighting system. We will now explore our framework around target drift, trading among companies within our portfolio, and portfolio turnover.
A stock drifting above the portfolio target is a result of that stock outperforming the portfolio. When this happens, we don’t want to be too quick to trim that stock back to target. According to the vast research on the momentum factor, “winning” stocks tend to continue winning in the near-term. In order to capture this additional source of return we allow companies to drift above their target. This process also makes our strategy more tax efficient by allowing more unrealized gains to accrued before we trim. Our process allows a stock to outperform the portfolio to the extent that its weighting in our portfolio exceeds our target weight by a few percentage points before we trim the position.
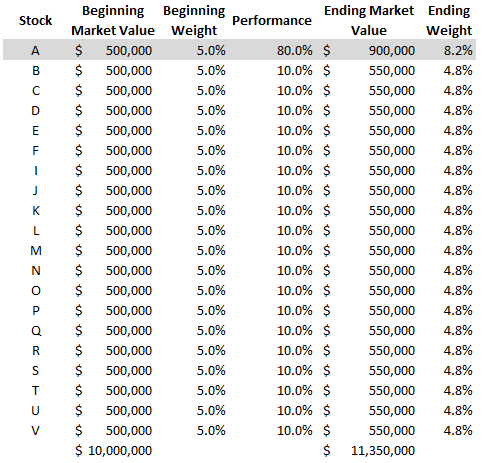
To simplify this example, we’ll use a static portfolio (i.e. the target/max not changing as the discount to fair value changes), rather than the dynamic portfolio we discussed in Part 5 . If you have a 20 equally weighted stock portfolio (Table 1) and all the stocks return 10% over the period, then their weighting is unchanged. In order for one of the holdings to have a ~3% higher weight than the initial target, it would need to outperform the rest of the portfolio by ~70%.
Table 1
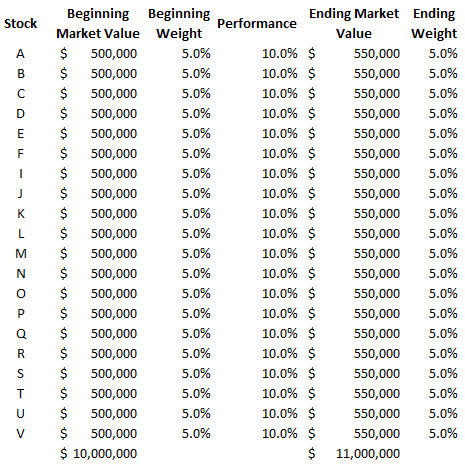
Table 2
As we’ve discussed in our previous posts, our dynamic model adjusts the target weight and their corresponding max weight as the discount to fair value changes (i.e. as the price or fair value changes). This means that in practice, it doesn’t take ~70% (as described above) of outperformance before a trim is recommended. Instead in the absence of any increase in our assessment of a stock’s fair value, about 15-30% outperformance will typically cause us to trim the position. However, when a stock increases in value by 30% over a relatively short time frame, there is usually new fundamental information that may also increase our assessment of the stock’s fair value, which may cause us to defer trimming the position.
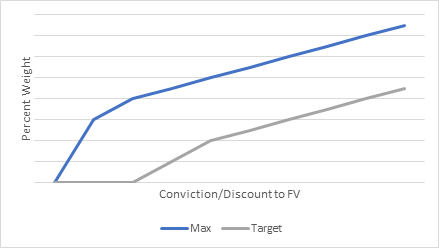
The difference between the target and the max weight is not the same amount throughout the weighting scheme. It gets larger as the target weight approaches and reaches 0%. We found that doing this reduces the portfolio turnover and is more consistent with the idea of us rating a stock as a “hold” (as opposed to a “buy” or “sell”). Here is an example of what this looks like:
To make sure that we’re fully invested in our best ideas (which as we know from the end of Part 5 is where a higher percent of our alpha is likely to come from), if there is a situation where a highly ranked company has underperformed the rest of the portfolio and is now underweight, and there is no new cash to invest, we’ll sell one of our lower ranked names to fund the purchase. We have a few conditions in order for this trade to occur. The funding source(s) must be above its current target and the improvement in the discount to fair value of the trade must be greater than 20%. This means that if stock A (which is underweight) has a current discount to fair value of 35% and stock B [the over-target funding source(s)] must have a discount to fair value of 15% or less. This 20% capture-premium is a threshold that we’ve deemed necessary to minimize turnover, but also keep the portfolio optimized. Importantly, we know that fair values are not precise calculations, but instead are the central point of a range of possible values. We believe that we can estimate fair values within a range of about +/-20% and so once a stock offers 20% more appreciation potential than another holding, we think the difference is statistically significant enough to make a trade.
As cash is available in the portfolio, then we’ll invest it according to the rank of the underweight stock (based on the matrix described in Part 5) as well as take into consideration our minimum trade size (i.e. we’re not going to make a trade to bring a stock from 4.9% to 5%).
Monitoring turnover is important for several reasons, but the typical way it’s calculated (the lesser of the sum of all securities sold or all securities purchased, divided by portfolio value) can be misleading in our view. We think this standard approach overly simplifies the analysis and might not reflect the true intentions of the manager. Someone from the outside might see a high turnover as the manager frequently changing their mind on portfolio companies, when in fact our view hasn’t changed. Rather, it’s the market’s view of the company that has changed.
We view turnover as being made of two types; internal and external. Internal turnover is when there is trading among portfolio holdings. We’ve recognized that some of our stocks have relatively stable fundamentals, but volatile stock prices. When this occurs, it provides excellent trading opportunities and allows us to shift those funds into higher expected return stocks. There are even times where we can totally exit a stock yet continue to follow it because we still believe it’s a great-but-expensive company, relative to other companies in our portfolio. In the normal view on turnover, an outsider might think we don’t like the company anymore, when in fact we do, but we have other opportunities that present a better potential return. Over time, the return potential of that company may come back into favor and we may buy it again.
External turnover on the other hand is driven by initiating coverage on new companies or us discontinuing coverage (with a final sale) of a company because we’ve lost confidence. In previous client conference calls we discussed the reasons why we discontinue coverage of companies and gave a range of examples of companies we’ve exited over time.
In general, we estimate that about 15%-20% of our portfolio turnover comes from us changing our mind on a company, with the balance of our turnover being driven by external factors such as market and individual stock volatility.
Sean will conclude this series with Part 7, bringing it all together through the lens of behavioral finance and how a system like this helps remove our inherent biases.
Please read important disclosures here.
Past performance is no guarantee of future results. All investments in securities carry risks, including the risk of losing one’s entire investment. The opinions expressed within this blog post are as of the date of publication and are provided for informational purposes only. Content will not be updated after publication and should not be considered current after the publication date. All opinions are subject to change without notice and due to changes in the market or economic conditions may not necessarily come to pass. Nothing contained herein should be construed as a comprehensive statement of the matters discussed, considered investment, financial, legal, or tax advice, or a recommendation to buy or sell any securities, and no investment decision should be made based solely on any information provided herein. Links to third party content are included for convenience only, we do not endorse, sponsor, or recommend any of the third parties or their websites and do not guarantee the adequacy of information contained within their websites. Please follow the link above for additional disclosure information.
About The Author: Paul Perrino
Paul is Ensemble Capital’s director of portfolio analysis. He implements the firm’s investment strategy in client accounts, while accounting for client specific customizations. Prior to joining Ensemble Capital, he was a Wealth Manager / Portfolio Manager at Grubman Wealth Management in Berkeley. Paul holds the Chartered Financial Analysis designation. He is a member of the CFA Institute and the CFA Society of San Francisco.
More posts by Paul Perrino