TripAdvisor: Strong Network Effect with Monetization Opportunities

August 20, 2018 in Audio, Equities, Mid Cap, North America, Transcripts, Wide-Moat Investing Summit, Wide-Moat Investing Summit 2018, Wide-Moat Investing Summit 2018 Featured

Thomas Bushey of Sunderland Capital Partners presented his in-depth investment thesis on TripAdvisor (Nasdaq: TRIP) at Wide-Moat Investing Summit 2018.

The full session is available exclusively to members of MOI Global.

Members, log in below to access the full session.

Not a member?

Thank you for your interest.  Please note that MOI Global is closed to new members at this time. If you would like to join the waiting list, complete the following form:

About the instructor:

Thomas Bushey has over fifteen years of experience managing and investing capital. Prior to founding Sunderland, he was a portfolio manager at Blackrock. Prior to Blackrock, Mr. Bushey was a Senior Analyst for Mayo Capital Partners from 2010 to 2012. Before that, he served a Senior Analyst at Millennium Partners from 2008 to 2009, where he was part of a global industrial investment team. Mr. Bushey began his career as an analyst for Credit Suisse First Boston (“CSFB”) and later moved to HCI Equity Partners (Thayer Capital). At CSFB, he executed and analyzed mergers, acquisitions, leveraged buyouts, divestitures, takeover defenses, restructurings and debt and equity financing for corporate clients and financial sponsors. At HCI, he was a member of the investment team responsible for private equity funds focused on industrial products and services. Mr. Bushey has a BS in Economics from the Wharton School of the University of Pennsylvania.

BofI: Compounding Machine in Form of Branchless Pure-Play Internet Bank

August 20, 2018 in Audio, Equities, Financials, Mid Cap, North America, Transcripts, Wide-Moat Investing Summit, Wide-Moat Investing Summit 2018, Wide-Moat Investing Summit 2018 Featured

Kaushal Majmudar and Sam Namiri of Ridgewood Investments presented their in-depth investment thesis on BofI Holding (Nasdaq: BOFI) at Wide-Moat Investing Summit 2018.

Thesis summary:

BofI Holding, based in San Diego, is a branchless pure-play internet bank that began operations as a private company in 2000. In the last eighteen years, BOFI has built a fast-growing nationwide banking platform that should continue to generate high returns on equity and assets for some time to come. BOFI’s low-cost business model is differentiated and underappreciated and not correctly valued by the market, partially due to periodic short attacks that are based on a misguided understanding of their business model or even misrepresentations.

The management team has done a great job with capital allocation, growing the bank profitably by developing new products, adding distribution channels, and via acquisitions. The bank completed its IPO in March 2005 at a split-adjusted price of $2.88 per share and recently traded at $43 per share. A price-based CAGR of ~23% annualized over the thirteen years since its IPO, over the same period of time the bank compounded BV per share at an annualized rate of ~17% per year and EPS by ~20% per year. BOFI is a compounding machine that can continue to grow EPS and BV per share at above-market rates for many years.

Trading at a forward P/E of 18x, the quality and consistency of BOFI’s differentiated model, low-cost position, quality of execution, and growth prospects offer patient investors an attractive opportunity to compound capital.

The following transcript has been edited for space and clarity.

Ken Majmudar: We love being part of this community, and we’re happy to have an opportunity to share our thoughts. By way of standard disclosure, let me note we own the idea at the center of this presentation.

Allow me to offer some background on myself and Sam. We started a micro-cap strategy on April 1, 2018. It’s called the Ridgewood Select Value Fund and focuses on small- and micro-cap equities. We are implementing a strategy for other investors that we’ve been doing inside the firm and Sam has done in his previous positions for many years.

The idea is to take concentrated positions in a handful of small- and micro-cap companies we see as having exceptional potential. We distinguish ourselves by taking quite a long-term investment view. Similar to Warren Buffett’s approach to being a businessman and an investor, we like to think like owners, which goes along with taking a long-term view. In addition, we look at it as taking a private equity approach even though we are investing in public companies. A big part of that is doing comprehensive due diligence, including Phil Fisher’s idea of scuttlebutt as presented in his great book “Common Stocks and Uncommon Profits” – talk to various people and try to develop multiple sources for validating ideas. We emphasize company visits and like to see managements and companies in their home environment. Capital allocation ability is also among our important criteria.

I’d like to touch on something we consider topical, namely active versus passive. Passive investing has gotten an incredible amount of fund flows more recently, but the trend has been going on for many years. One implication of this trend is that a lot of active managers have been losing assets – over $200 billion in 2017 in U.S. equities alone went from active managers or active funds to passive managers or passive index funds. The growth of ETFs has also been a part of this trend. In this relation, the question on our minds is whether this is affecting price discovery because with all of these assets moving from the active side to the passive side, the result has been less research and work on trying to find value. We have also had momentum taking over in big segments of the market. ETFs provide an “automatic bid.” One thing that goes part and parcel of this trend towards indexing is that the greater the ownership in a given security of indexes and ETFs, the less reactive to new information and events it is, as some studies have shown. With stocks that have the highest proportion from indexes, new events seem to affect them less than stocks with a greater proportion of active managers and owners. It’s an interesting observation. Since there’s less capital in active funds, there’s also less money in the aggregate available through fees and other channels to fund the cost of research, which has overall reduced price discovery in the marketplace.

Another interesting thing is that ETFs, by the nature of their structure, have to emphasize the liquidity of the positions. There is a little-known change Standard and Poor’s made to the calculation methodology of the S&P 500. Over ten years ago, it used to be based just on market cap, but then S&P float-adjusted the market cap. This is interesting because it means that in securities where the insider ownership is high and going higher, their representation in the index would go in the exact opposite direction, and the vice-versa is also true. That’s fascinating, and a lot of people seem to be unaware of this change. The credit for noticing goes to some of the folks at Horizon Asset Management, as well as Howard Marks in one of his recent papers. They noted a lot of the stuff is going on in indexing and some elements of it are pretty interesting to look at but also somewhat troubling.

By the way, we are big believers in indexing, so the point of this is not to say indexing is a problem but that there are things going on that are troubling in various aspects. There is a saying that goes “What the wise man does in the beginning, the fool does in the end,” so it’s interesting to note that the increase in fund flows creates a self-sustaining cycle. George Soros has a interesting model he calls reflexivity, meaning the decisions of investors affect reality and vice-versa. What’s going on now in this indexing trend is that fund flows are reinforcing the validity of indexing, which is, in turn, reinforcing the fund flows. It’s a positive feedback loop, but it could also lead to extremes and has already done so in some of these assets. An interesting question to ask is what the limit to these fund flows will be. An engaging talk from the folks at Horizon suggested that since most of the fund flows are coming from active to passive, we have something they describe as the “bank of active.” That in itself is limited to an extent: at present, indexing in about 45% of the overall market, and most people think the percentage can go higher, but clearly it can’t go to 100%. It would be interesting to see; we don’t know the answer, but we think it’s an essential question to ask.

For these reasons, we see a lot of opportunity in the areas that are excluded from indexation and ETFs or are just a small percentage of the assets in total. Small caps and micro caps are one such area, in our opinion. It’s interesting to note that, in the aggregate, small caps and micro caps represent more than 80% by number of companies, but small caps account for less than 10% of the total market capitalization, and microcaps – an area where we see a lot of opportunity – represent less than 1%. These numbers may seem surprising, but in a market capitalization-weighted world, you have companies such as Amazon, Google, Apple, and Facebook, which have individual market caps of anything from $500 billion to more than $800 billion, so any of these companies exceeds the totality of all micro caps put together. However, we think there’s an exceptional opportunity in these areas, and as the changes have gone on to the profitability of trading for Wall Street firms, there has been less and less liquidity and increasingly less coverage in the micro-cap area, which makes it an excellent time to look for value there.

Our choice of investment idea is US-traded BofI Holdings (ticker BOFI), BofI standing for Bank of Internet. In mid-June 2018, the stock was trading at about $42.40, giving the company a market cap of approximately $2.65 billion. Depending on who you ask, the cut-off for small cap is under either $2 billion or $3 billion, so some would define BofI as a small cap, and others would call it a micro cap. Our price target is for approximately 50% appreciation from here into the low $60s, which we think could occur within the next two to three years.

BofI is a bank, but while most banks have many branches and a fair amount of overhead, BofI started with the idea that technology and the Internet would allow a bank to have a national footprint without the traditional branch model. The bank operates from one or two buildings in San Diego, California.

We have followed this company for many years and like the advantage it has in terms of its low-cost, proven business model. We’ve also observed it has a history of effective capital allocation into various areas with good risk-adjusted returns. The bank has superior ROIs and ROEs relative to its competitors.

BofI was started in 2000 as a private company and IPO’d in 2005 at a split-adjusted price of $2.88 per share. If you had bought it in the IPO, you’d have CAGR of approximately 23% since then. But not only the price return has been excellent: since 2005, the company has compounded its book value at 17% per year and its EPS by 20% per year. It’s interesting because it’s one of the few publicly traded pure-play internet banks, without the brick-and-mortar branches that add a lot of cost.

We think highly of the company’s management. Greg Garranbrantz, who became CEO in 2007, has done a great job. He has a high-pedigree background as a former investment banker from Goldman Sachs and a management consultant before that at McKinsey & Co. He owns a significant stake in the bank: 1.2 million shares worth just over $50 million. The CFO, Andrew Micheletti, has also done a good job. He joined the bank six years prior to Greg and also owns a substantial stake in the business.

At Ridgewood, we focus on finding what we call compounding machines, and we have been doing this for a long time. BofI definitely qualifies, and we have had a position in it for many years. The company has been relatively consistent (at least on an annualized basis) in compounding earnings and book value, which is helping it compound the stock price as well. We believe this bank can keep doing this for many years to come.

Since this is a bank, we have to discuss loan origination. In a bank, you have assets and liabilities. Counterintuitively, the liabilities are the deposits and borrowings, which is the money customers give you. The loans are the amounts you give to others at higher interest rates than you give to your customers or your lenders, thereby generating a spread. In addition to that spread between the cost of money and the amount you can charge for it, you also have some fee income. One thing you see in a growth bank is its ability to generate assets, i.e., loans. One of the reasons this bank has performed so well on a profitability and earnings basis is its ability to grow its loan portfolio, which generates a lot of its income. Of course, it’s essential for a bank not only to generate a lot of loan growth but to generate good loans that will pay the money back with interest. BofI has done that. When you see a fast-growing bank, it is important to focus not only on the top line, revenue, and loan growth but also to make sure the loans the bank is making are of good credit quality and will pay back. In the 2008/2009 financial crisis, they made a lot of loans, but those were bad loans. It can happen sometimes and is something to be aware of. However, we think BofI understands that point and has done a wonderful job of growing its loan portfolio extremely carefully and intelligently.

This bank has some substantial cost advantages because of its branchless operations, among other things. This is apparent when you compare BofI’s core business margins to those of other banks. One of the major line items for most banks as a percentage of assets is their net interest income. There shouldn’t be a huge difference between the high-end banks as they compete against each other. If BofI was charging a lot more for its money or giving a lot less to depositors, it would show in that business line. As it is, its net interest margin is a little higher than that of the typical bank. The big difference is on the cost side. BofI has a cost advantage when it comes to its overheads for salary and benefits because it doesn’t have branches to staff with lots of people. Rather, it has two office buildings next to each other, and the entire bank and all the staff are run from that branch using technology.

Similarly, it doesn’t need to spend as much as competitors on premises and equipment because it doesn’t have much of a real estate footprint. Its non-interest expenses are also quite lower for the same reason. Cumulatively, this has led to BofI exiting 2017 with a core business margin of 2.37% versus 0.57% for regular banks. Since we’re talking about percent of assets, 2.37% is a big number for a bank getting close to around $10 billion of assets. One way to think about it is that its cost structure and its way of operating have allowed the bank to be far more profitable than the majority of its competitors of a similar size.

Sam Namiri: Let me start by noting that one of the advantages Geico has over other insurance companies is a business model structurally different from that of most other insurance companies. BofI also has this difference in business structural model that gives it the advantage of being a better-run bank than other competitors. This, in turn, allows it to do and try different things and to sustain its advantage over a long period of time.

When BofI started in 2000 as an online-only bank, people didn’t have smartphones. If you wanted to deposit a check, you had to mail it in. As other issues have come up over time, the bank has developed its entire business and has been able to solve any potential issues and address risks in its business. It has built a customer acquisition model through online marketing; it has distribution partners; and it is starting to get even more into using the data collected over a long period of time, which gives the bank yet another advantage. It has a massive amount of online data collected from existing and potential customers and hasn’t yet used much of it, but it is now starting to mine the data and do a much better job of using it to cross-sell.

The bank is also starting to use more automation, which would be difficult for a company with a bunch of branches all over the place. As BofI is a digital-only operation, it can do far more things, on the sale side as well. It has many of its own outbound call center staff, and its bankers are typically in a call center too. BofI was among the first to be able to accept online check deposits. If you have an account with the bank, you can call and either get your personal direct banker or deal with another banker at the call center. With its balance sheet, it securitizes some of the loans it writes and sells them off in addition to typically structured standard loans. That also helps the bank to maintain a strong balance sheet. Thanks to its core digital capabilities, BofI can use less staff than other banks would need to do the same thing.

In terms of the different segments it lends in, BofI has historically done an excellent job. Whenever it sees one lending area get competitive and believes the risk-adjusted returns are strong, it can allocate more capital and shift its focus to less competitive ones. That’s one way it’s been able to start new products as well. A structural advantage BofI has is that it tries not to do things a lot of the big banks do. An example is the single-family jumbo loans – many banks don’t like to give loans to people who don’t have a standard income, who don’t get paid through a job or get your typical pay stubs. What BofI does is give jumbo loans to people who maybe own their business and don’t get paid unless the business makes money. It’s hard to show a pay stub in such instances. BofI will go in and say, “Hey, you own your business and have a lot of assets; you’re able to pay for 40% of an expensive home in a nice big market like L.A., San Francisco, or New York.” And it will give the loan at a 60% loan-to-value (LTV) because it feels comfortable that the real estate prices aren’t going to drop too much and the borrower still has a good credit score despite not having the typical pay stub to show.

That’s one of the businesses the company seriously got into between 2012 and 2014, and it mentioned on a recent call that the business had gotten much more competitive. It has not written as many loans in that area as in the past. Instead, in the last couple of years, it has got into commercial and industrial (C&I) lending and equipment leasing, where it lends out at pretty high interest rates to businesses that don’t want to own the equipment and prefer to lease it. Other banks don’t want to do the work to truly realize whether the business is viable enough to be able to pay and cover that lease. I believe BofI has never had one bad loan in that equipment leasing business since it started.

Majmudar: I’d like to make an analogy with a specialty insurer. If you’re a bank and are able to look in the niches, there’s generally less competition and more opportunity if you’re willing to go into head-to-head competition on the commodity side of the business, as specialty insurers do. That’s part of the quality of this bank and the management team, who realize it and have a platform where they’ve developed this focus over time.

Namiri: Also, BofI is not afraid to admit that a certain segment is getting competitive and to back off during those times and lean up in that area while not fully getting out of that business because every loan is its own business in a way. You could still write loans and have staff there to keeps that structure in place, so once it gets less competitive, you can go back and pick up steam in that line of lending. BofI has historically done a good job of that.

The bank also does commercial real estate lending, most of it so far in the Southern California market. One of the reasons it went into that was because banks get certain benefits from writing loans within their community area. BofI went into small business lending through a good deal it signed with H&R Block. It also does consumer loans, which is a newer line of business for the company. It started doing prime auto lending, which has done well for it over the past couple of years, and this business started organically. And it started dabbling recently in unsecured lending and consumer lending, which is immaterial for its business currently but was a segment it thought could potentially work well.

Some of the numbers speak clearly to the strength of the business. For example, checking growth from 2013 to 2018, in terms of deposits, is 913%, while the savings growth is 268%. Originally, one of the knocks BofI took came from paying a lot of money for the deposits: in June 2013, when it had $2.1 billion in deposits, 50% of that base was time deposits, which are CDs and other higher interest rate deposit accounts and less in checking and savings. By March 2018, the deposit base had grown to $8 billion, and the company had managed to get 50% in checking and similar deposits and 30% in savings deposits, which are much lower rate interest than CDs, while the share of time deposits had shrunk to 17%.

Being an online-only bank has allowed BofI to achieve that. It doesn’t charge you anything at all to have a bank account, even at smaller minimums, and can also give you interest on your checking account. Depending on the checking account you have as a consumer, you can get up to 1.25% interest. This is the type of account where you can take the money out the same day or wire it out. Another benefit the bank can offer is no ATM fees. In other words, you can use it like a real bank and get a good amount of interest. I myself have a checking account with BofI because it makes sense to have one – why leave money on the table and have a checking account with Chase or Wells Fargo that pay either zero or little interest, especially with the low interest rates today? BofI has been able to do that, and it’s been a strength in its business.

Another good thing is that the deposit base is throughout the whole country, in all regions of the US. If one region has an issue economically, people may get worried and make a run on their deposits at a local branch, but BofI doesn’t have that risk.

With this company, the moat is the fact that it has been able to keep its costs low. There is also the fact that it is a great capital allocator. Evidence of that are the much higher returns BofI has been able to generate compared to most banks: its return on assets at the end of 2017 was 1.79% versus 0.85% for its peers, which puts it in the top 10% of all banks with assets of $1 billion or more. Even when you consider the largest banks in the country which have such great scale that they’re able to get the best returns, BofI ranks high up there. And it’s not just in return on assets and return on equity: it is in the top 20% in G&A and the top 6% in terms of the efficiency ratio, which is an essential ratio for banks.

One of the reasons BofI has been able to do this is because it is a disruptor and has been one for a long time. Legacy banks can’t copy its business model because they have so much infrastructure in place (bank branches and employees), and they can’t compete with themselves and launch their own online-only banking subsidiary or segment. If they do, they will be faced with the issue of whether to brand it separately, which would mean not using any of the brand advantage they’ve built over the years. If they decide not to associate the two, it could create different issues. In short, it’s hard to be a mix of two bank models if you’ve been doing it one way for a long time.

Majmudar: Allow me to add that the efficiency ratio represents non-interest operating expenses divided by the income of the bank., lower is better. People generally consider below 50% to be quite good. Peers are above 50%, and BofI is well below 50% (just under 33%) because of the structural difference in its business model.

Namiri: In terms of its competitive advantage, BofI has done an excellent job and continues to do it in finding new products and relationships it can build upon. For instance, it gets a lot of its mortgages (single family mortgages) through a relationship it has with Costco. Whenever a Costco customer wants to do a mortgage through Costco, the lead gets sent over to BofI, which underwrites the loan and its bankers deal with it. There is also the deal with H&R Block, which used to have a bank and was either forced to or decided to sell off that banking division. BofI runs four different products for H&R Block and gets paid a fee, so this has been a nice income generator for the bank since 2015.

One of the impressive things about BofI is that it has been able to grow its assets quickly but do so with good credit quality and while making sure it doesn’t have high loan losses. The bank focuses on that: when you go and talk to its underwriters, you’ll see that the first thing isn’t how many loans they can process in the long run but how to make sure they are getting enough information on the borrower to be comfortable that he or she will be able to pay back. If a situation arises where the borrower can’t repay, the underwriters make sure the asset value is so high and the LTV ratio so strong that if the bank has to foreclose on the asset, it will still get the money. The bank has a lot of checks and balances in place, not only culturally but also structurally. With the jumbo loans, it is strict in terms of the markets and only lends to dense markets. That’s because when it looks at the appraisal value, it doesn’t want it to be based off comps which aren’t relevant. In a dense market, there will usually be enough sales of a related property nearby to make the appraisal value more accurate. If you go to a small town, for instance, there may be certain issues with that one piece of land or piece of property that the appraisal value doesn’t capture.

The bank looks at new products in two ways. Sometimes, it looks at building them organically and testing them in small amounts. If it sees that the product is not competitive or it can get good risk-adjusted returns, it will go and hire a team that’s been doing it longer and has a strong track record of small loan losses and loan charge-offs. BofI did that with the C&I lending, acquiring the team that had been doing it for a long time in a bank which considered this an insignificant part of its business and not worth keeping it around. Total net charge-offs annualized are 0.07 for BofI against 0.26 for comparable banks, making this another area where BofI is best-in-class. Then, the amount of loans that are in non-accrual to total loans is 0.38 for BofI compared to 0.78 for peers. Even after the Great Recession, BofI’s net charge-off never went above 1%. Going into 2008, it was not writing many loans because it felt that lots of people were chasing loans and writing them at poor risk-adjusted returns. BofI chose to sit on the sidelines and have its money in a lot of Ginnies and Fannies. One of the reasons it was able to survive during that time was because it didn’t chase these poor loans. The peak in charge-offs was just under 0.8% in 2011, which was when the worst of the foreclosure crisis was going on in the U.S.

When speaking about strong capital allocation, it feels appropriate to bring up something CEO Greg Garrabrants told the San Diego Union Tribune in 2010: “As organization failed, we hired the best.” The article was about how BofI managed to hire the teams of two of the better performing lenders in two different industries. When it got into the jumbo home loan market in 2010, there was a company called Thornburg Mortgage (TM). It went bankrupt after the financial crisis not because it wrote poor loans but because the securitization market for home lending dried up during that time, so it wasn’t able to fund any new loans. TM had all these employees and all this overhead, and it was writing loans and then, all of a sudden, it couldn’t write any more loans because it didn’t have any more funding for them. The company went bankrupt, and BofI was able to purchase loans from TM. What’s more, it was able to cherry-pick the best ones because TM was in a funding crisis and needed to get as many forms of funding as it could for new loans, so it had to sell off only the best loans because nobody wanted any of the worst loans it had. BofI effectively continued the same strategy TM had employed – writing low LTV loans in prime housing markets – but because BofI uses deposits for its funding, it avoids the risk that pushed TM into bankruptcy. In 2010, BofI effectively had zero jumbo loan production, but it reported $324 million in jumbo loans in the March 2018 quarter. The company also revealed an average FICO score of 713 and LTV of 59.2%. The latter means that if a borrower doesn’t pay back a loan, BofI effectively has more than a 40% cushion on the value of the property that it can drop before the bank loses money.

Another example of hiring the best whenever it has the opportunity is Morgan Ferris, who came on board when BofI entered the multifamily loan market in 2010. Ferris was formerly with Commercial Capital Bancorp, which was acquired by Washington Mutual for $1 billion. BofI brought him in to oversee and develop that product. The bank had $141 million in multifamily loans in the March 2018 quarter. The stats here are also quite impressive: the LTV is 56.2%, and the debt service coverage ratio is 1.32. The total multifamily loan portfolio has grown to $1.75 billion from zero in 2010. This goes to show the bank is not only doing a good job of growing its loan book in those two segments, but it is also keen on keeping strong credit statistics on its loans.

Another example is the entry in the auto lending market. In the second quarter of 2016, the book was $20 million and had grown to just under $100 a year later. Today, the size of the auto lending book is just under $200 million.

Since 2011, BofI has grown its business through three categories: a new product, a new distribution channel, and M&A. It has been opportunistic in all three different areas. It was doing H&R Block franchising lending, and in 2017, it added refund advance for H&R Block. This gave it a new product to offer H&R Block customers who wanted to receive their tax refund in advance, and then BofI would effectively have the right to their tax refund once the customer received it. Upon that relationship, the bank was able to build a new distribution channel. One area of growth it sees going on in the future is cross-selling other products it has to H&R Block customers who have never heard of BofI before.

Majmudar: We see these developments as a sign of the quality of the culture and the management. The company leaders are smart and opportunistic about finding opportunities and incrementally growing in all these three different ways.

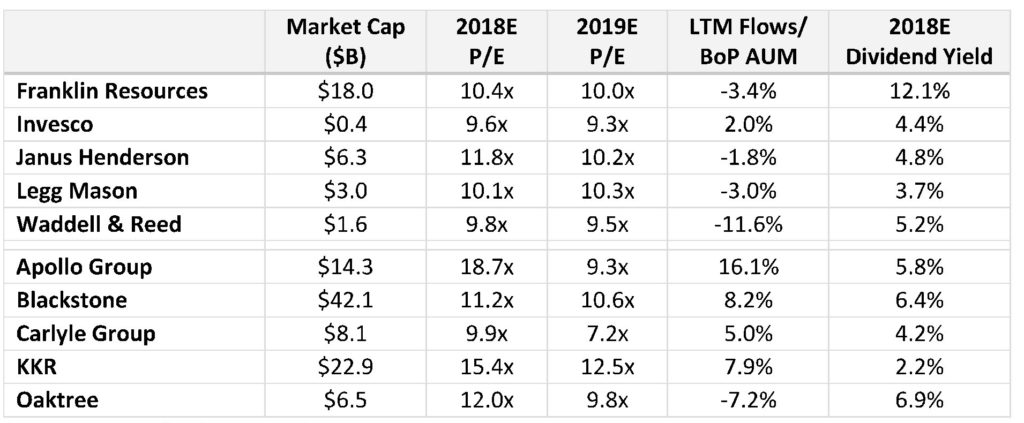
Namiri: BofI doesn’t give guidance but provides targets it internally looks for, typically net interest margin targets and return on equity. When we look at BofI and try to figure out what future value we place on the business, we typically look out at least two years. Assuming the lower end of its net interest margin targets (380 to 400 basis points) and assuming the company can grow its assets by 15% annually over the next two years (which it has been able to do and which we consider pretty conservative), we get a $3.10 EPS estimate in fiscal 2019. We think BofI can increase that to $3.50 EPS in fiscal 2020. The top 30 comparable banks (of approximately the same market cap, loan and asset size) are trading at an average of 18.45x next year’s PE and 17.76x the two-year forward PE. However, these other banks have a projected average ROE of 8.9% and ROA of 1.1%, while the respective figures for BofI are 17.5% and 1.8%.

Using that $3.50 EPS and giving it an 18x PE multiple – which seems quite reasonable because of the ROE and ROA BofI generates versus its competitors – we get a $63 per share price target in two years, which is a 45% gain over that time. BofI also expects to have $180 million in excess capital by the end of fiscal 2019. CEO Greg Garrabrants mentioned in a recent call he intends to deploy that via a buyback, dividend, or M&A, or a combination of the three depending on where he feels he’ll get the best risk-adjusted returns.

I think there’s even more upside opportunity. The bank has been working on the so-called Universal Digital Bank initiative and has spent a lot of money developing it. It’s close to being finished and will connect all the different lines of lending, the different deposits, and other consumer-facing accounts so the company can start cross-marketing and cross-selling. If, for example, you have a single family loan with BofI, it may find you would be a good candidate for an unsecured consumer loan and can start targeting you effectively. It makes sense on all ends and is one thing the bank didn’t have in the past. It may help to grow the business at an even faster pace.

I think it’s important to note that BofI has had short attacks on its business starting sometime in 2015. Some anonymous Twitter characters would have these impressive, lengthy Seeking Alpha write-ups that cherry-picked things, for example, some of the single-family jumbo loans BofI had given in the past. When you read them, and when you don’t know the bank or you don’t know banking well, it scares you and works on your emotions. People could say something like, ”Oh, wow, I don’t want to touch a business that has given a loan to somebody who has been in jail.” These writers did a good job and have done it with other businesses in the past. I think the main reason they are doing it is not necessarily to point out some issues the bank has but to make regulators go look at it and to do a deep dive where they may not normally do. The company has gone through three audits since then and these Seeking Alpha write-ups also triggered class action lawsuits against the company.

As an investor, such things leave you questioning whether it’s worth being invested in this business. Both Ken and I have known this company and its management for many years, and Ken in particular has invested in banks for a long time, so he’s able to take things apart and see what matters and what doesn’t. More recently, there was an article about BofI making a loan to Jared Kushner’s family company; it said no one else wanted to give a loan to this family, but BofI was willing to do it. The piece questioned the management, saying it was doing a poor job overseeing the loan book. In reality, when you look at that specific loan, you see the LTV was so low that the bank covered a lot of the risk in lending to that specific project. In addition, it was getting an extremely high interest rate, which again compensated for the risk it was taking to some degree.

The short attack articles are among the reasons we believe to be behind BofI’s currently favorable multiple given the quality of the business based on ROE and ROA and the growth the company has been showing and will continue to show, in our opinion. Before these articles appeared, BofI was getting multiples of 25x to 30x PE multiple versus today’s 18x. The risk here is that the short continue to attack – the short interest in the stock is still quite high, and that is a risk we’re aware of. We think it is unfounded, but it can work on human emotions and drag the stock down, at least in the short run.

Our model also assumes the historical credit performance of BofI stays at least flat and doesn’t uptick. If there’s an economic downturn, it may become an issue for the bank, as may a real estate crisis where the value of the real estate drops in excess of 40%-50%. Also, our model assumes BofI can grow assets by 15% a year, but it may not be able to do that. Additionally, it will have to grow the deposit base to some degree, which would be another risk if it can’t do it. It has shown itself capable of achieving both in the past, and we believe it will continue to do it in the future.

Besides, it will have around $180 million to $190 million in excess capital to deploy in about a year, and there’s a risk it may deploy it poorly. However, it has such a strong track record of not doing it – it waited patiently on the sidelines during the Great Recession for another opportunity to deploy capital. It makes sense to expect it will be patient again and act opportunistically.

Majmudar: Let me sum up by saying BofI is a position we’ve held for a long time, buying in at a time when this was a much smaller company. It’s the type of company we’re looking to put into our micro-cap fund. We also think it is absolutely not too late for other investors as this remains a compounding machine that has a long way to go, in our internal view.

John Mihaljevic: Guys, thank you so much for taking the time to share your thesis in such great detail. We truly appreciate it, and I think it will be quite valuable to our community. For those who would like to track this idea over time, what would be some data points on the fundamental side to either validate or challenge your thesis?

Majmudar: Fundamentally, you look at things like net interest margin and the efficiency ratio, as well as the credit loss statistics. Those, in my opinion, are the key ones for banks. Another one is the growth in assets and liabilities.

Those five statistics have been good at this bank, not only on growth but in the quality of that growth and efficiency. We think this is a far above average bank trading at a average multiple. It’s about a $2.5 billion company, so it can still keep doing what it’s doing and grow a lot larger as it maintains the culture and the quality and should be worth far more down the road.

Then we have things like technology and all the innovations, such as the concept of the digital universal bank. With such innovations coming in, it will only become a more fruitful area for a smaller bank to use technology to grow. There’s still a lot of potential in fintech, which is an area that has had all venture capitalists truly excited in recent years with things like cryptocurrencies, for example. Here you have a publicly traded bank that’s innovative and already profitable, so we think it should be trading at a higher multiple, and it will probably have higher EPS and book value two, three, or five years from now.

The following are excerpts of the Q&A session with Kaushal Majmudar and Sam Namiri:

Q: Are there public comparables you would say are similar in terms of their approach and technological advancement?

Namiri: I found some in the micro cap space that are effectively startups, but I’ve never found a bank that lends out its own money and writes its own loans. I found certain comps that have one part of the technology aspect, but not actual banks.

One of the things BofI has developed is an API allowing a fintech company to open a bank account pretty quickly using the API. BofI struck a partnership for a product called MaxMyInterest, which determines what checking accounts consumers should use to get the highest interest rate but also keep their money FDIC-secured.

But to go back to your question, I don’t think there are any comps like BofI – I haven’t found anything that is online-only and able to generate the quality of loans and the quality of deposit base BofI have.

Majmudar: Any bank of this size – $5 billion to $15 billion asset range – is the comps people look at. The difference is that virtually all of them have physical branches. In a sense, they’re all banks, but this one is quite different from the rest. Outside of BofI, you can look at other innovative financial companies (LendingClub comes to mind) that are doing pieces of this.

Depending on your view, on what you’re looking for in a comp, it could be the other banks of a similar size. But in terms of a bank doing things the way BofI is doing, it’s quite unique, which is part of what makes us quite excited about what this idea represents.

About the instructors:

Kaushal “Ken” Majmudar, CFA founded Ridgewood Investments in 2002 and serves as its Chief Investment Officer focusing on managing long-term Value Investing based strategies. Ken’s high level experience and work with clients has been recognized and cited on multiple occasions. He is a noted value investor who has written and spoken extensively on the subject of value investing and intelligent investing. Prior to founding Ridgewood Investments in late 2002, Ken worked for seven years on Wall Street as an investment banker at Merrill Lynch and Lehman Brothers where he has extensive experience working on initial public offerings, mergers and acquisitions transactions and other corporate finance advisory work for Fortune 1000 companies. He has been a member of the Value Investors Club – an online members-only group for skilled value investors founded by Joel Greenblatt – where he posted a buy recommendation on Nvidia in 2002 – possibly one of the best long-term investment ideas ever posted on VIC. He has also been a member of SumZero – an online community for professional investors, and written for SeekingAlpha – among others. Ken graduated with honors from the Harvard Law School in 1994 after being an honors graduate of Columbia University in 1991 with a bachelor’s degree in Computer Science. He is admitted to the Bar in NY and NJ, though retired from the practice of law, as well as a member of the CFA Institute and EO (Entrepreneurs Organization).

Sam Namiri recently joined Ridgewood to help build its Small and Microcap investments and will be co-managing the Ridgewood Select Value Fund with Ken. Prior to Ridgewood, Sam spent five years as an associate at Grand Slam Asset Management, a small cap value based Hedge Fund. Sam graduated with a bachelor’s in Industrial Engineering and Operations Research from UC Berkeley in 2005 and an MBA from Columbia Business School in 2012.

A10 Networks: Attractive Valuation Caused by Reporting Issues

August 18, 2018 in Equities, Ideas, Letters

This article is excerpted from a letter by MOI Global instructor Jim Roumell, partner and portfolio manager of Roumell Asset Management (RAM), based in Chevy Chase, Maryland. Jim is a valued participant in The Zurich Project.

ATEN is listed on the New York Stock Exchange and is a provider of secure application solutions. Its portfolio of software and hardware solutions enables customers to secure their applications, users and infrastructure from internet, web and network threats at scale.

As the cyber threat landscape intensifies and network architectures evolve, ATEN provides customers with greater security, visibility, flexibility, management and performance for their applications. ATEN’s customers include cloud providers, web-scale companies, service providers, government organizations and other private enterprises.

During the fourth quarter of 2017, ATEN discovered that a mid-level employee within its finance department had violated the Company’s Insider Trading Policy and Code of Conduct. As a result, ATEN, with the assistance of outside counsel, conducted a review to ensure the accuracy of its reporting for 2017. The review did not identify matters that required material adjustments.

Members, log in below to access the restricted content.

Not a member?

Thank you for your interest.  Please note that MOI Global is closed to new members at this time. If you would like to join the waiting list, complete the following form:

Disclosure: The specific securities identified and described do not represent all of the securities purchased, sold, or recommended for advisory clients, and the reader should not assume that investments in the securities identified and discussed were or will be profitable. The top three securities purchased in the quarter are based on the largest absolute dollar purchases made in the quarter. Roumell Asset Management, LLC claims compliance with the Global Investment Performance Standards (GIPS®) and has prepared and presented this report in compliance with the GIPS standards. Roumell Asset Management, LLC has been independently verified for the periods January 1, 1999 through December 31, 2017. Verification assesses whether (1) the firm has complied with all the composite construction requirements of the GIPS standards on a firm-wide basis and (2) the firm’s policies and procedures are designed to calculate and present performance in compliance with the GIPS standards. Verification does not ensure the accuracy of any specific composite presentation. The Balanced Composite has been examined for the periods January 1, 1999 through December 31, 2017. The verification and performance examination reports are available upon request. Roumell Asset Management, LLC is an independent registered investment adviser. The firm maintains a complete list and description of composites, which is available upon request. Results are based on fully discretionary accounts under management, including those accounts no longer with the firm. Past performance is not indicative of future results. The U.S. dollar is the currency used to express performance. Returns are presented net of management fees and include the reinvestment of all income. Net of fee performance was calculated using actual management fees. From 2010 to 2013, for certain of these accounts, net returns have been reduced by a performance-based fee of 20% of profits, paid annually in the first quarter. Net returns are reduced by all fees and transaction costs incurred. Wrap fee accounts pay a fee based on a percentage of assets under management. Other than brokerage commissions, this fee includes investment management, portfolio monitoring, consulting services, and in some cases, custodial services. Prior to and post 2006, there were no wrap fee accounts in the composite. For the year ended December 31, 2006, wrap fee accounts made up less than 1% of the composite. Wrap fee schedules are provided by independent wrap sponsors and are available upon request from the respective wrap sponsor. Returns include the effect of foreign currency exchange rates. Exchange rate source utilized by the portfolios within the composite may vary. Composite performance is presented net of foreign withholding taxes. Withholding taxes may vary according to the investor’s domicile. The annual composite dispersion presented is an asset-weighted standard deviation calculated for the accounts in the composite for the entire year. Dispersion calculations are greater as a result of managing accounts on a client relationship basis. Securities are bought based on the combined value of all portfolios of a client relationship and then allocated to one account within a client relationship. Therefore, accounts within a client relationship will hold different securities. The result is greater dispersion amongst accounts. The 3-year annualized ex-post standard deviation of the composite and/or benchmark is not presented for the period prior to December 31, 2012, because 36 monthly returns are not available. Policies for valuing portfolios, calculating performance, and preparing compliant presentations are available upon request. The investment management fee schedule for the composite is as follows: for Direct Portfolio Management Services: 1.30% on the first $1,000,000, and 1.00% on assets over $1,000,000; for Sub-Adviser Services: determined by adviser; for Wrap Fee Services: determined by sponsor. Actual investment advisory fees incurred by clients may vary.

Public Private Equity: Volatility vs. Franchise Value

August 18, 2018 in Equities, Letters

This article is excerpted from a letter by MOI Global instructor Patrick Brennan, portfolio manager of Brennan Asset Management.

Throughout our past letters, we have discussed how public values and capital structures often look far different than those of private companies and noted how several of our current names would likely be the exact types of names (predictable businesses that generate substantial free cash flows) that have made private equity firms substantial money over the years. The private equity name is a bit of misnomer, considering that the largest firms are now public entities which are now referred to as alternative investment managers. These firms are often in the headlines on a daily basis, given their role in various merger transactions and their ubiquitous capital raising activity. The firms are also regularly lambasted for their extravagant pay to senior executives and are often whipping boys in any discussion about tax fairness. Despite their incredible growth in total assets under management (AUM), the stocks have generally been underperformers. As just one example, Blackstone’s (BX) stock is essentially flat since its public offering in 2007 (they have paid out $16.49 in dividends over this time period), while its AUM has roughly quintupled.

Private equity firms generally pay themselves an underlying management and incentive fee equal to a percentage of total profits above a hurdle rate of return. While the timing of the latter is nearly impossible to predict (and very difficult for investors to model), the carry fees offer enormous payouts over a cycle. And despite the higher fee levels, the alternative managers generally show significant outperformance relative to their benchmarks. Furthermore, investor assets are often locked up for multi-year periods, sometimes as long as 10-20 years, depending on the fund.

Additionally, the alternative managers have successfully expanded their franchises into private credit, real estate, insurance among several other verticals and nearly all have posted strong growth. These characteristics contrast with traditional managers who normally charge only base management fees, offer daily liquidity, have posted mixed results versus benchmarks and have suffered meaningful AUM losses to index funds. As the alternative equity firms are generally structured as partnerships, the vast majority of the businesses’ tax burden is pushed to the individual limited partners. So, which model sounds more attractive? Well, this is more difficult to ascertain if one simply looks at trading multiples, even considering the traditional managers’ significant 2018 stock pullbacks.


Source: Morgan Stanley Research

There are various explanations for the above contradiction. Some argue that the golden era for private equity cannot continue and returns are likely to compress, especially since such large amounts of committed but uninvested funds (dry powder) must be invested at high prices. Others argue that returns are merely a function of leverage and sector selection, and there is little to no alpha after these adjustments.[3] There is the possibility of tax law change on the carried interest and the certainty of interest deduction limitations. Additionally, a big market pullback will delay performance fees and could meaningfully lower earnings. Finally, these names are complex, have volatile earnings/stock prices and have K1 structures that make them difficult for many institutions to own. While all factors partially explain the valuation differentials, we suspect the last might be the dominant factor.

We have watched these names from a distance for years but passed for various reasons (including in 2010…particularly brilliant on our part), partially because of the worry about a change in the taxation of carried interest (still a concern) and the “cycle” timing. These names will sell off during market turmoil and therefore a better time to purchase would certainly be during a market dislocation. But, as we continued to do work over the past year, we spent more time thinking about the difficulty of trying to recreate these models. It might take 20+ years to create the track record and institutional goodwill that these names have attained. Should the firms technically compare their leveraged returns to leveraged S&P 500 returns? Sure, but how many investors could handle the volatility associated with that strategy? How many institutions have access to the deal flow, contact bases and data from all the various deals closed (and passed on) over time?

It is true that any market pullback will delay performance fees. But, with the private equity industry sitting on nearly $1.7 trillion in dry powder, these names would be well positioned to benefit from market declines. And while these nearly incomprehensible levels of funds might appear impossible to rationally invest, it should be noted that private markets are far larger than in past years with the total percentage of dry powder as a percentage of unrealized fair value actually below its longer-term average.

Source: Prequin, Morgan Stanley Research

Source: Prequin, Morgan Stanley Research

As noted, the industry’s fund-raising capabilities are immense. We can attest to the difficulty of raising small amounts of money. How likely would it be for a new firm to start at zero and eventually raise over $100 billion? On the most simplistic basis, it is worth asking: “What will be the alternative industry’s organic AUM levels over the next 1, 3, and 5 years?” We suspect the answer is “higher to significantly higher.” At a 2014 investor day, BX estimated fee growth of 12% annually, a 60% discount to historical levels. It is worth noting that some of the frequently discussed structural changes could conceivably help the largest alternative managers. Often the largest, most recognizable alternative managers take market share within the alternative space as institutions consolidate relationships. It is costly to closely track multiple managers and therefore the largest names often benefit when institutions reduce the number of mangers and/or benefit or suffer little damage when institutions reduce alternative allocations.

The alternative asset managers typically are valued on the basis of fee-related earnings, current carried interest and existing balance sheet assets. While one can argue that other firms screen cheaper on these metrics or have more room to grow total AUM (unclear they will actually do so), we believe that BX has the most diverse revenue stream and the strongest fund-raising franchise and therefore initiated a smaller position. Again, it is better to purchase these names during periods of market turmoil and therefore we’ve left substantial room to scale into the positions over time. Other alternative managers, with KKR the most recent, have announced plans to convert into a publicly traded company, willingly choosing to pay taxes in hopes that investors ascribe a higher multiple for the structure simplicity. BX pays less in taxes and such a decision would therefore be even more costly from a tax perspective. While a conversion would undoubtedly move shares higher shorter- term, we hope BX decides against such a move and instead opts to repurchase additional shares. We’ve heard that complex, tax-avoiding firms can actually do fairly well over time.

[3] Financial Analyst Journal Volume 72, July/August 2016: A Bottom-Up Approach to the Risk-Adjusted Performance of the Buyout Fund Market, Jean-François L’Her, CFA, Rossitsa Stoyanova, Kathryn Shaw, William Scott, CFA, and Charissa Lai, CFA.
[4] We show the year of each strategy’s first fund.

Disclaimer: BAM’s investment decision making process involves a number of different factors, not just those discussed in this document. The views expressed in this material are subject to ongoing evaluation and could change at any time. Past performance is not indicative of future results, which may vary. The value of investments and the income derived from investments can go down as well as up. It shall not be assumed that recommendations made in the future will be profitable or will equal the performance of the securities mentioned here. While BAM seeks to design a portfolio which reflects appropriate risk and return features, portfolio characteristics may deviate from those of the benchmark. Although BAM follows the same investment strategy for each advisory client with similar investment objectives and financial condition, differences in client holdings are dictated by variations in clients’ investment guidelines and risk tolerances. BAM may continue to hold a certain security in one client account while selling it for another client account when client guidelines or risk tolerances mandate a sale for a particular client. In some cases, consistent with client objectives and risk, BAM may purchase a security for one client while selling it for another. Consistent with specific client objectives and risk tolerance, clients’ trades may be executed at different times and at different prices. Each of these factors influences the overall performance of the investment strategies followed by the Firm. Nothing herein should be construed as a solicitation or offer, or recommendation to buy or sell any security, or as an offer to provide advisory services in any jurisdiction in which such solicitation or offer would be unlawful under the securities laws of such jurisdiction. The material provided herein is for informational purposes only. Before engaging BAM, prospective clients are strongly urged to perform additional due diligence, to ask additional questions of BAM as they deem appropriate, and to discuss any prospective investment with their legal and tax advisers.

Tim McElvaine Sums Up His Investment Thesis on GE

August 17, 2018 in Deep Value, Diary, Equities, Full Video, Ideas, Industrial Conglomerates, Large Cap, North America, Special Situations

General Electric, shunned by the investment community, has registered on the radar screens of a few value-oriented investors whom we deeply respect.

On August 9th, MOI Global member and Peter Cundill protege Tim McElvaine, founder and president of McElvaine Investment Management, posted a video explaining why the fund he manages recently bought shares of GE.

Watch the video below or on the website of The McElvaine Investment Trust:

Interested in further context on the GE turnaround?

Consider what MOI Global instructor Glenn Surowiec, portfolio manager of GDS Investments, wrote in his letter to investors in July:

… a cornerstone of successful investing is the ability to look ahead without dwelling on past mistakes. As present-day General Electric investors, we are buying into the future of the company, and not the past. In our 2017 Year-End Letter, we commented upon the appointment of new CEO John Flannery and looked ahead with our expectation that Mr. Flannery would reverse General Electric’s well-documented recent troubles by restructuring the company’s non-core businesses. That expectation is now reality.

On April 26, 2018, The Wall Street Journal reported that General Electric turned down an offer from Danaher Corporation (NYSE: DHR) to purchase General Electric’s Life Sciences unit at a price in the $20B range. That unit generates approximately one-quarter of GE Healthcare’s total sales, and General Electric’s refusal to sell in the stated price range speaks volumes about the value which the company places on Life Sciences. Further cementing that valuation is the fact that Siemens AG (FWB: SIE) recently spun-off its medical imaging and diagnostics division (Healthineers) for $35B. If the same valuation metrics which were applied to Healthineers were applied to GE Healthcare, General Electric shareholders could realize more than $60B from a spinoff of that unit . . . a spin-off which we expect will be completed within the next 12 to 18 months.

General Electric will soon close on a transaction to merge the transportation business component of GE Aviation with Wabtec Corporation (NYSE: WAB). In that $11B deal, General Electric will realize nearly $3B in cash while its shareholders will own 40.2% of the new company. The structure of that transaction will bring significant advantages while allowing General Electric, under Mr. Flannery’s leadership, to continue to optimize its portfolio of businesses.

We expect that optimization will include (A) General Electric’s sale of its gas engine business to private equity firm Advent International for $3B, (B) the company’s sale of its 62.5% stake in Baker Hughes (NYSE: BHGE) over the next 36 months, and (C) as noted, the spin-off of GE Healthcare.

The General Electric turnaround will not be quick, and it will require a healthy dose of the patience about which we wrote in our 2017 Year-End Letter. We remain confident, though, that patience will be well-rewarded.

Replay Glenn Surowiec’s session on GE at Best Ideas 2018.

Active vs Passive Investing

August 17, 2018 in Equities, Letters

This article is excerpted from a letter by Luis Sanchez and John Pelly, co-founders and managing partners of Overlook Rock Asset Management, based in New York.

Passive investing with index Exchange Traded Funds (“ETFs”) is all the rage now. Here we’ll briefly discuss what they are, why they’re such a great product for generating wealth for their investors (when used properly!), and how we view Overlook Rock’s strategy as being distinct from (and superior to) the index ETFs out there. In particular, we’ll focus on the “gold standard” ETFs: tickers SPY and IWV. We’ll save a more detailed discussion for a future write-up.

For those unaware of how ETFs work, think of them as a bundle of stocks that are sold as a unit. A manager (an investment corporation) constructs a bundle of stocks according to a set of rules and offers that bundle as a single security that you can buy and sell on a stock exchange (NYSE, NASDAQ, etc) with your broker (Merrill Lynch, Schwab, TD Ameritrade, etc). Roughly, when you buy/sell an ETF, the manager goes out and buys/sells the shares that make up that stock bundle, holds those stocks in the investment vehicle, and creates new shares of the ETF that you wind up holding.

Index ETFs are designed to track market indices. These products have proliferated significantly over the last decade – there are ETFs to track all manner of “indices.” Two in particular that we focus on for this discussion are the SPDR S&P 500 Trust ETF(ticker “SPY”, managed by State Street Global Advisors) and the iShares Russell 3000 ETF(ticker “IWV”, managed by Black Rock). The SPY consists of the 500 largest US stocks and the IWV consists of the largest 3000 stocks (including the 500 stocks in the SPY). The SPY and IWV are good proxies for the US stock market as a whole.

Again – we’ll save a lot of juicy details about the benefits and risks of index investing for another, purpose-built write-up. But for now, we’ll just say: We believe index investing is a foolproof way to get rich over time, provided:1) you do it the right way and 2) you can’t find a better way.

If we (John and Luis) were investing in SPY and/or IWV the “right” way, that would look roughly as follows:

  • Dollar cost average: Periodically invest our cash in roughly equal amounts on a regular basis-once a month or quarter, over several years. If we had a large amount of cash upfront, we’d spread it over 4-8 quarters.
  • Invest with a long term horizon: We would not invest any money that we would need to access in the next 5+ (ideally 10+) years.
  • Stick with it: Stay invested and do not sell holdings when there’s fear and panic (i.e. big drops).

Those steps are listed in increasing order of difficulty. Especially the last step. It can be excruciatingly difficult for many to hold onto their holdings when a recession hits and the market drops 20, 30, 40%. Numerous studies show how people pull their money out just at the bottom and put it back in close to the top. As a species, humans’ default emotional wiring is not well equipped to handle financial markets.

But those who follow the general instructions above would definitely get rich. Why? Because they are broadly participating in the incredible economic engine of the United States in a very low cost, effective manner.

Absent adding any real economic value, the vast majority of other investment products out there just can’t measure up. The sad fact is (with lots of data to back it up) that most other investment products out there under perform the S&P 500. They’re either “closet indexers” (mirroring the index but charging higher fees), or “(hyper)active managers” that don’t have the discipline, drive, or emotional fortitude to invest in a way that can repeatedly generate superior performance.

We want to emphasize that SPY and IWV are great ways to get rich, over a long period of time.

However, we’d like to get us and our clients richer faster (who wouldn’t?). We believe we’ve found a way to do it. Read on.

As mentioned above, passive ETFs (including SPY and IWV) pick stocks according to a set of rigid rules. For SPY / IWV, the process is:

  • Pick the 500 (SPY) or 3000 (IWV) stocks with the highest market capitalizations.
  • Hold each stock in a ratio equivalent to their market capitalization size.
  • Adjust the portfolio periodically to reflect steps 1-2 (once a quarter for SPY, once a year for IWV).

Quite simply, these are pretty brain-dead rules:

  • Picking a stock just because its market capitalization is high, and in proportion to the market cap size, is like buying a car solely because its expensive. If the dealer doubles the price, you would own twice as many…?!
  • Re-balancing like clockwork every quarter (for SPY) and every year (for IWV) is incredibly simple and in fact gamed – many active managers buy stocks (either new or increasing in portfolio weight) in anticipation of what SPY, IWV and others like are going to buy. This drives the prices of those stocks up ahead of the ETF purchases, enriching others at the ETF investor’s expense.

And yet, every dollar you invested in SPY 5 years ago (starting June 28, 2013) to the last trading day of the quarter we write about (June 29, 2018) would be worth just under $1.87, for a compound annual rate of return of 13.3%. Maybe a brain dead scheme can work?

Let’s look at another 5 year period: March 15, 2004 to March 9, 2009. Over this period an investment in SPY would have turned $1 into $0.66, a compound loss of 8.1% per year.

That takes a bit of shine off SPY! Now, for those of you that know your financial market history, you’d know that March 9, 2009 was the absolute bottom tick of SPY during the Great Recession. So you could legitimately argue we carefully picked the start and end dates to prove how bad SPY can be. Fair enough – but also keep in mind that that 13.3% number is coming from the other side of that very low point, and is a very unrealistic assessment of what we can expect from SPY over the long run, and extremely unrealistic of where SPY could go over the next 5 years. On the whole, it is far, far more likely to be much less than 13%.

Empirically, the data show that the “long run” (10+ years) average returns for SPY is in the 8-10% per year range. This assumes you stay invested that entire period and reinvest your dividends.

Not a bad long term expectation, but at Overlook Rock, we think we can do better. Here’s why:

We have developed a set of rules that are much more profitable than those embodied by SPY and IWV as outlined above. They are derived from first principles regarding what makes for a valuable business by looking at a company’s fundamentals, then empirically tested over almost 20 years of historical data. In aggregate, the companies selected by these rules should meaningfully outperform SPY and IWV over time, even net of our fees.

We evaluate the entire universe of stocks, scouring for those that are cheap relative to earnings, high quality (have sustainable competitive advantages), or are paying decent dividends. We sell when those criteria no longer hold, and put clients into other cheaper, higher quality, or greater dividend paying names. By systematically keeping the portfolio focused on these 3 characteristics, we expect to dramatically improve on passive products.

That’s why we set our bogeys as SPY and IWV, and report them alongside our performance. SPY and IWV are both simple, easy ways to outperform 80%+ of the investment managers out there. If we can’t beat both the SPY and IWM over the long run, net of fees,we need to find a new job.

We believe this is a higher standard than most investment managers are willing to live by – in other words, perfectly appropriate for our clients.

Disclaimer: Overlook Rock Asset Management is a registered investment adviser. Information presented is for discussion and educational purposes only and does not intend to make an offer or solicitation for the sale or purchase of any specific securities, investments, or investment strategies. Investments involve risk and, unless otherwise stated, are not guaranteed. Be sure to first consult with a qualified financial adviser and/or tax professional before implementing any strategy discussed herein. The information and statistical data contained herein have been obtained from sources, which we believe to be reliable, but in no way are warranted by us to accuracy or completeness. We do not undertake to advise you as to any change in figures or our views. This is not a solicitation of any order to buy or sell. We, any officer, or any member of their families, may have a position in and may from time to time purchase or sell any of the above mentioned or related securities. Past results are no guarantee of future Results. This report includes candid statements and observations regarding investment strategies, individual securities, and economic and market conditions; however, there is no guarantee that these statements, opinions or forecasts will prove to be correct. These comments may also include the expression of opinions that are speculative in nature and should not be relied on as statements of fact. Overlook Rock Asset Management is committed to communicating with our investment partners as candidly as possible because we believe our investors benefit from understanding our investment philosophy, investment process, stock selection methodology and investor temperament. Our views and opinions include “forward-looking statements” which may or may not be accurate over the long term. You should not place undue reliance on forward-looking statements, which are current as of the date of this report. We disclaim any obligation to update or alter any forward-looking statements, whether as a result of new information, future events or otherwise. While we believe we have a reasonable basis for our appraisals and we have confidence in our opinions, actual results may differ materially from those we anticipate. The information provided in this material should not be considered a recommendation to buy, sell or hold any particular security.

Highlighted Tweet by NeckarValue

August 16, 2018 in Twitter

Hidden Advantages to Hybrid Public-Family Businesses

August 14, 2018 in Equities, Featured, Jockey Stocks, Letters

This article is authored by MOI Global instructor Will Thomson, managing partner of Massif Capital, a value-oriented partnership focused on the small- and mid-cap space, with special attention on industrial and commodity-related businesses.

“A finite game is played for the purpose of winning, an infinite game for the purpose of continuing to play.” –James P. Carse

Most companies believe they are in a finite game, playing against a timeline of quarterly earnings with known competitors and known rules for determining a winner. A 2005 study from Duke University found that close to 80% of Chief Financial Officers of the 400 largest publicly traded U.S. companies would rather sacrifice the firm’s economic value to meet quarterly expectations. The “game” of business is an infinite game and sacrificing value for short-term market appeasement is a losing strategy. Long-term value is predicated on endurance and firms that use growth merely as a vehicle to sustain or appreciate the share price, will not survive.

Introduction

When we examine a new firm, we look to create a framework that allows us to study the long-term incentive structure and the capital allocation decision process of the management team. Additionally, a framework provides a template to identify the strengths and weakness of similar firms and more quickly assess the likelihood that a firm holds a competitive advantage relative to their peers.

An often-overlooked business model is the hybrid public-family business. Hybrid public-family businesses (“family business”) are publicly traded, family-controlled firms. Families need not necessarily have founded the firm, although they often do, nor do they need to be majority shareholders, but usually are. These firms often defy simple categorization – not only do they include multi-billion-dollar corporations in almost every industry, but also include a significant percentage of all small and mid-capitalization companies globally.

Family businesses today are a diverse and adaptive collection of organizations that often get criticized for corporate backwardness, paternalism, and operational weaknesses. Many family businesses are the backbone of emerging economies and remain at the core of most developed countries small and medium-size business ecosystems. Despite the presumed shortcomings, these firms tend to outperform other publicly traded business with other corporate structures.

What follows is a proposed framework that highlights the inherent strengths of family businesses and how those strengths closely align with our view of an enduring organization that can deliver long-term value to shareholders. One of the reasons we find the framework so appealing is that successful family businesses seem to be a highly distilled version of the traits of many successful long-term enterprises, be they family businesses or not.

Family Business Context

Family businesses are characterized by a combination of two institutions, the family, and the business. Historically this form of business organization not only contributed significantly to economic development but was the worlds principal business structure. This is especially true for economies before the emergence of a large-scale manufacturing business in the United States in the 1870s.[1]

The second industrial revolution, which is generally considered to be the period from 1870 to 1914, is perhaps best characterized by the resulting spread of capital-intensive industries with complex production and distribution channels. The growth in complexity and capital intensity was accompanied by (or perhaps necessitated) a shift from family capitalism to financial capitalism, and the emergence of “modern management practices.” According to Alfred Chandler, this transition was the beginning of the end for the dominance of the family firm as “no family or financial institution was large enough to staff the managerial hierarchies required to minister modern multiunit enterprises.”[2]

The post WW2 period has seen the public perception of the family firm as being in a state of permeant decline. Family firms were incapable of competing since the advent of the large, professionalized managerial enterprises solidified, especially in the volumes of literature on business structure and management practices. As Danny and Isabel Miller noted in their in-depth study of the competitive advantages of family businesses, Managing for the Long Run, the public perception seems strange given the numerous examples of successful family firms discussed in the voluminous literature on how different companies succeeded, such as In Search of Excellence and Built to Last.

The Miller’s highlight this oddity stating: “When, via a mutual friend, we passed on this observation [the observation that so many examples of successful firms and businesses as family-run firms] to one of the authors of these books [In Search of Excellence], his response was, ‘The companies were successful despite being FCBs [Family Controlled Business].’ Like many businesses scholars, he seemed to be missing the point.”[3] We agree business scholars seemed to have missed the point.

The failure of business scholars begins with their inability to recognize the flexibility of the family business model. Specifically, the inability to grasp that while family businesses in a traditional sense persist as essential parts of the economy, the hybrid public-family business model does as well, for example, the Lundin Group of companies, or any number of Asian family-owned industrial conglomerates. In the case of the Lundin Family, whenever they decided to develop a resource, be it a mine or an oil and natural gas deposit, the family utilized the hybrid public family business model: retaining management control for the family while turning over technical tasks to more-experienced companies and drawing on capital from retail and institutional investors around the globe.

The Framework

There are three unique characteristics we identify in a hybrid family business model that are at the core of their success:
1. An inherent alignment of owner and manager interests;
2. The presence of multigenerational time horizons, and;
3. The implementation of a value-based system versus a resource-based system.

Each characteristic has a subsequent impact on operations. The operational impact of these traits not only govern how the firm is managed but also impact its reputation and its earning power. Ultimately, we believe these operational impacts produce real value.

Within family business groups, owners and managers are often synonymous. The resulting alignment creates an environment where risk and reward are understood as one in the same. Drawing parallels to ‘skin in the game,’ managers must manage risk knowing they are exposed to its consequences. Similarly, they are motivated to pursue greater earnings, understanding that they will share in the reward.

Ownership provides a simple, effective, and often inexpensive method to prevents excess risk-taking while creating an environment where leaders are free to pursue contrarian ideas and quickly commit resources.

Ownership though is not the same things as owning stock because of a compensation arrangement. This is a point missed by most. Stock options, the most common source of compensation for management teams at publicly traded companies, is a financialized derivative, an abstraction masquerading as ownership. Ownership typically requires hard work and is accompanied by illiquidity, a lack of diversification and a lack of concern regarding the moment to moment liquid value of something. These are characteristics of ownership that bring focus to management activities. Ownership also tends to come with the weight of history.

Multi-generational ownership comes with a sense of responsibility and stewardship. Growth is too easily pursued at the expense of a balance sheet in a world awash with money and is too often thought of as the “end goal’ or “objective.” Growth is merely directional guidance though and does not indicate “why” a firm is growing, or “where” it is looking to grow to. Preservation of inherited assets and a deep sense of responsibility to protect the long-term health of the company are often paramount for family businesses. Endurance is prioritized over growth; patient capital is deployed at the expense of near-term profitability. While the result may not yield the new darling of Wall Street, it provides investors who care about the preservation of capital an excellent store of long-term value.

Finally, hybrid family businesses tend to make decisions based on a set of values, often passed down from the founding entrepreneur. Most businesses have some semblance of a value statement or mission, but very few allocate resources based on those values. In periods of market volatility or intense competition, companies will often allocate resources to mirror what their successful counterparts are doing. In a value- based system, the market and competitors are certainly important input variables; however, they do not govern the actions of the firm. Shared values create a clear company identity, and resources are spent ensuring the integrity of the company rather than the short-term appeal.

The alignment of owners and managers, multi-generational time horizons and value-based decision making all have operational impacts that produce long-term value. Value is frequently discussed in the context of a listed market price relative to the firm’s estimated intrinsic value; looking beyond price, a firms value can be assessed through the lens of a firm’s independence, endurance, and scarcity. For example, firms, where leaders are free to commit and allocate resources efficiently, have healthier balance sheets then firms weighed down by bureaucracy, and an inability to produce succinct and focused decisions. Similarly, firms that can monetize their reputation and trustworthiness and then nurture and prioritize that relationship are built to endure. A firm that focuses intently on their ability to endure, not merely to grow are often excellent companies to consider for a long-term store of value.

Finally, firms that have an intense value system and allocate resources accordingly, often produce products of such quality that they create market scarcity. In the long run, they serve an economic or social need that creates natural barriers to entry for industry competitors.

It would be inaccurate to presume that all hybrid family businesses share these characteristics, yet many do. While success can always be attributed to a product, an individual, or market dynamics, we believe the traits we have outlined above often define hybrid family businesses and lay a foundation for an enduring company.

[1] The History of Family Businesses 1850 -2000, pg. 6.
[2] Managerial Hierarchies. Comparative Perspectives on the Rise of the Modern Industrial Enterprise.
[3] Managing for the Long Run, pg. 13.

Disclaimer: Opinions expressed herein by Massif Capital, LLC (Massif Capital) are not an investment recommendation and are not meant to be relied upon in investment decisions. Massif Capital’s opinions expressed herein address only select aspects of potential investment in securities of the companies mentioned and cannot be a substitute for comprehensive investment analysis. Any analysis presented herein is limited in scope, based on an incomplete set of information, and has limitations to its accuracy. Massif Capital recommends that potential and existing investors conduct thorough investment research of their own, including a detailed review of the companies’ regulatory filings, public statements, and competitors. Consulting a qualified investment adviser may be prudent. The information upon which this material is based and was obtained from sources believed to be reliable, but has not been independently verified. Therefore, Massif Capital cannot guarantee its accuracy. Any opinions or estimates constitute Massif Capital’s best judgment as of the date of publication and are subject to change without notice. Massif Capital explicitly disclaims any liability that may arise from the use of this material; reliance upon information in this publication is at the sole discretion of the reader. Furthermore, under no circumstances is this publication an offer to sell or a solicitation to buy securities or services discussed herein.

MOI Global